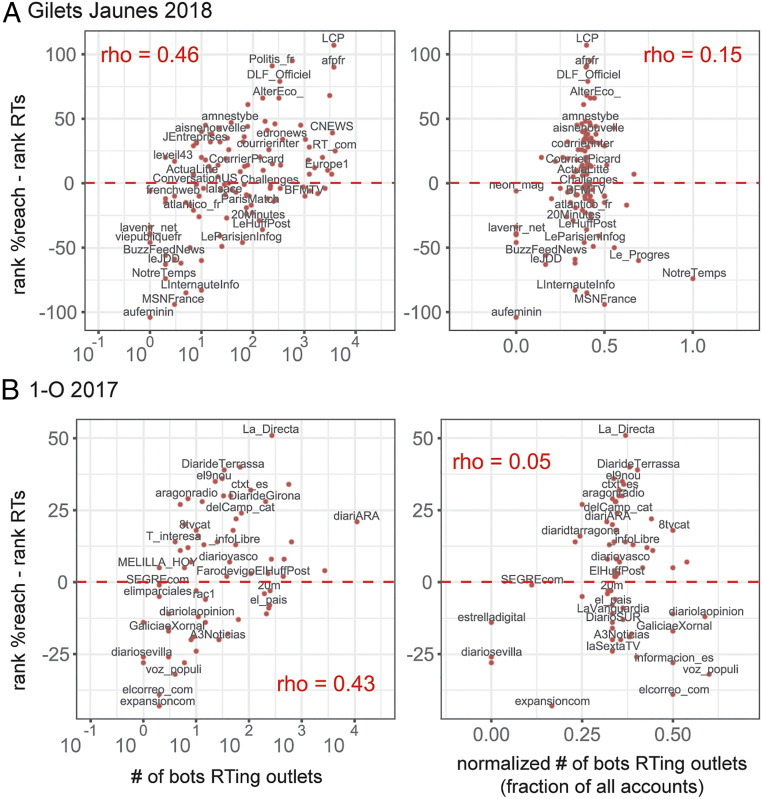
Fig. 5.
Number of bots retweeting news outlets. Panel A shows correlations in the Yellow Vests data; panel B shows correlations in the Catalan Referendum data. The scatterplots measure the association between the number of unverified bots retweeting news outlets and the differences in visibility rankings (identified in Fig. 3, operationalized here as rank % reach – rank RTs). This allows us to relate the difference between Twitter and web-tracking ranks with bot retweeting activity. Outlets above the 0 line have better ranking on Twitter; outlets below the 0 line have better ranking on the web. The horizontal axes measure the number of unverified bots retweeting news outlets (left column) and the number of bots normalized by neighborhood size (right column). The scatterplots on the Left suggest that news outlets that have a higher number of retweeting bots have more salience on Twitter than on the web. However, the association disappears once we normalize the number of bots as a fraction of the neighborhood. News outlets that are more visible on Twitter simply have more accounts retweeting their content, including human accounts.

