Fig. 6.
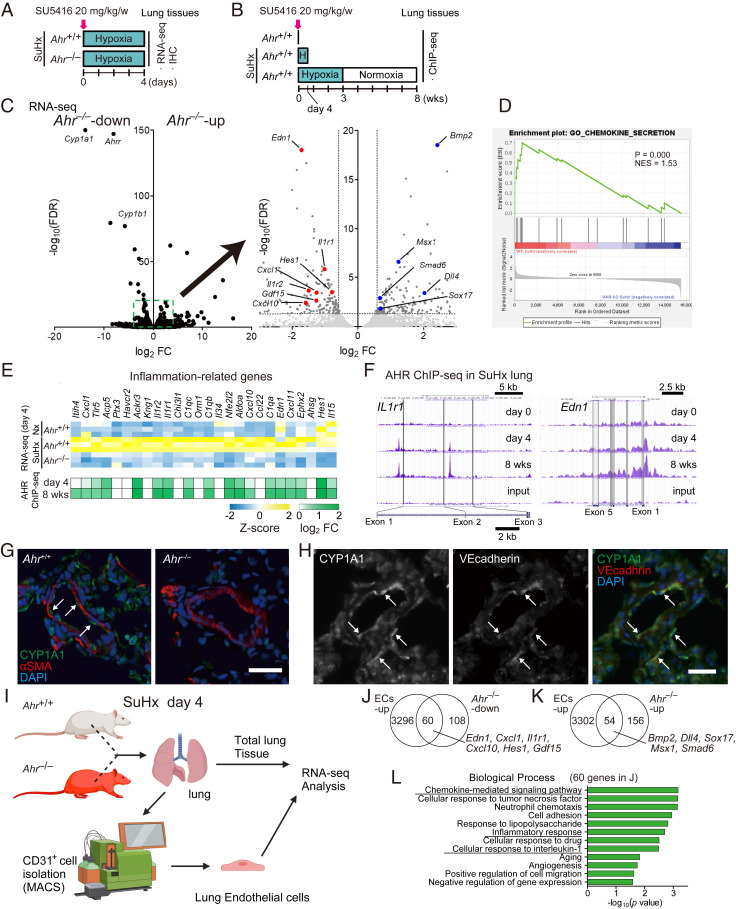
Activation of AHR induces inflammation-related genes in endothelial cells of SuHx rats. (A) Experimental protocol for immunohistofluorescent analysis and RNA-seq analysis in the early stage (day 4) of SuHx rats. SU5416 was subcutaneously administered to Ahr+/+ and Ahr−/− rats once on day 0 (n = 3 for each group). (B) Experimental protocol for ChIP-seq analysis of SuHx rats. SU5416 was subcutaneously administered to Ahr+/+ rats once on day 0 (n = 3 pooled samples for each group). (C, Left) Volcano plot of AHR-dependent gene expression in SuHx rat lung on day 4. Typical AHR target genes are depicted in the plot. (C, Right) Enlarged diagram of the dashed box in the Left. PAH-related genes are depicted in the plot. (D) GSEA analysis of genes differentially expressed between Ahr+/+ and Ahr−/− rats in the SuHx model with normalized P value and enrichment score (NES) for chemokine secretion. (E) Z-score of representative inflammation-related genes up-regulated in SuHx and AHR binding on these genes expressed as log2 fold change. (F) Representative ChIP-seq data of AHR in SuHx rat lung (days 0, 4, and 8 wk). (G) Representative immunofluorescence images of pulmonary arteries stained for CYP1A1 (green) and αSMA (red) in lung tissues of Ahr+/+ (Left) and Ahr−/− (Right) on day 4 after SU5416 administration. Arrows indicate ECs. (Scale bar, 30 μm.) (H) Representative images of pulmonary arteries stained for CYP1A1 (Left) and VE-cadherin (Middle) in lung tissues of Ahr+/+ SuHx rat on day 4; merged image is shown at Right. Arrows indicate representative cells double-stained for CYP1A1 and VE-cadherin. (Scale bar, 30 μm.) (I) Illustrative scheme of preparation of rat total lung tissue and CD31+ ECs for RNA-seq analysis. (J) Venn diagram of genes up-regulated in ECs (ECs-up) and genes down-regulated in Ahr−/− (Ahr−/−-down). (K) Venn diagram of ECs-up and genes up-regulated in Ahr−/− (Ahr−/−-up). (L) GO enrichment analysis of the 60 genes indicated in J.

