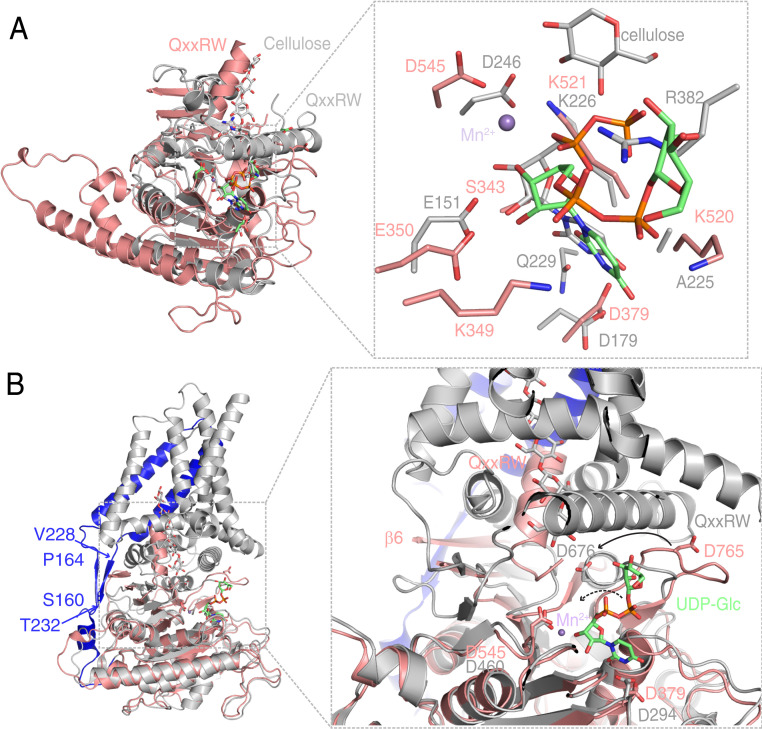
Fig. 4.
Structural comparisons of AtCESA3CatD to BcsA and PttCESA8 reveal different mechanisms in coordinating UDP-Glc. (A) Structural comparison of AtCESA3CatD (salmon) to the BcsA catalytic domain (PDB ID code 4HG6; gray). An enlarged view of the catalytic sites involving UDP-Glc and metal ion binding in AtCESA3 and BcsA is shown on the Right. The bound cellulose and UDP-Glc are shown as sticks. For cellulose, C and O atoms are colored gray and red; for UDP-Glc in BcsA, C, O, N, and P atoms are colored gray, red, blue, and orange, respectively. (B) Structural alignment of AtCESA3CatD and full-length PttCESA8 (PDB ID code 6WLB). The PttCESA8 is colored gray, with its N-terminal region (E157-Q249) prior to the GT domain in blue. The two β-strands connecting the first two transmembrane helices to cytosolic domains are indicated by the starting and ending amino acids, respectively. A detailed view of catalytic sites and the glucan chain channel of AtCESA3CatD and PttCESA8 is shown on the Right. The conserved residues that bind UDP-Glc are show as sticks, and the bound Mn2+ is shown as spheres. The cellulose chain in PttCESA8 is shown as sticks, with C and O atoms colored gray and red. The conformational change in the catalytic residue D765 in AtCESA3CatD compared with its equivalent residue D676 in PttCESA8 is indicated by the solid arrow. A proposed change in UDP-Glc in AtCESA3CatD, following the same change direction as that of D765, is indicated by the dashed arrow. β6 in AtCESA3CatD and canonical QxxRW motif in both structures are labeled. Structural comparison also clearly demonstrates a large conformational change in the helix comprising the QxxRW motif, implying that it is dynamic and flexible.

