Fig. 3.
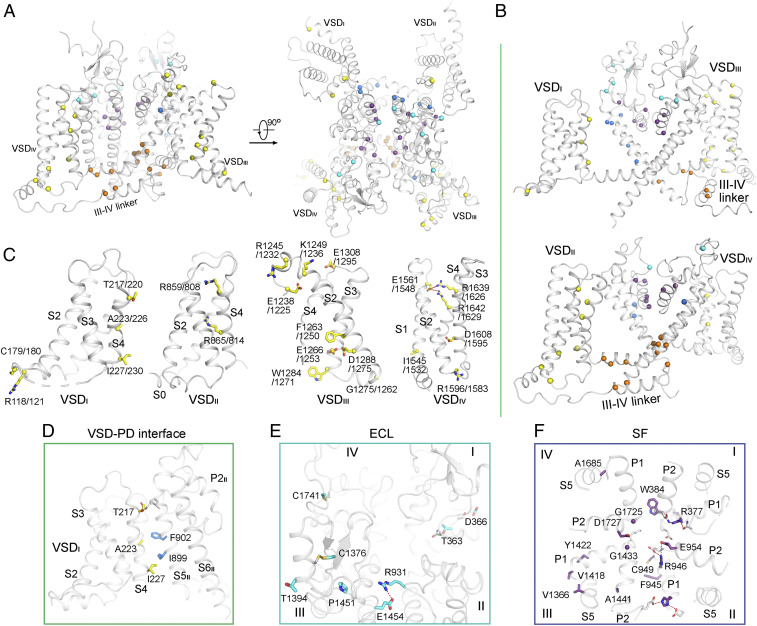
Structural mapping of the disease-related missense mutations that are common to Nav1.1 and Nav1.5. (A) Mapping of the disease-associated missense mutations common to Nav1.1 and Nav1.5 on the structure of Nav1.1. (B) The diagonal repeats in Nav1.1 are shown in the top and bottom rows. (C) Distribution of the common disease mutations on the VSDs. The residue numbers of Nav1.1 and Nav1.5 are labeled before and after the slash, respectively. The Cα atoms and side chains of the related residues are shown as spheres and sticks, respectively, and colored by structural entities defined in Fig. 2. (D) A cluster of common disease-related residues mapped to the interface between VSDI and S5II. (E and F) The majority of common disease-related residues in ECL (E) and SF (F) may be involved in structural integrity. In E, a tilted extracellular view is shown. In F, an extracellular view of the SF and the supporting segments is shown. The common disease residues are shown as sticks and labeled conforming to their sequence number in Nav1.1. The polar interactions are indicated by the red dashed line. The color scheme in this figure is the same as defined in Fig. 2.

