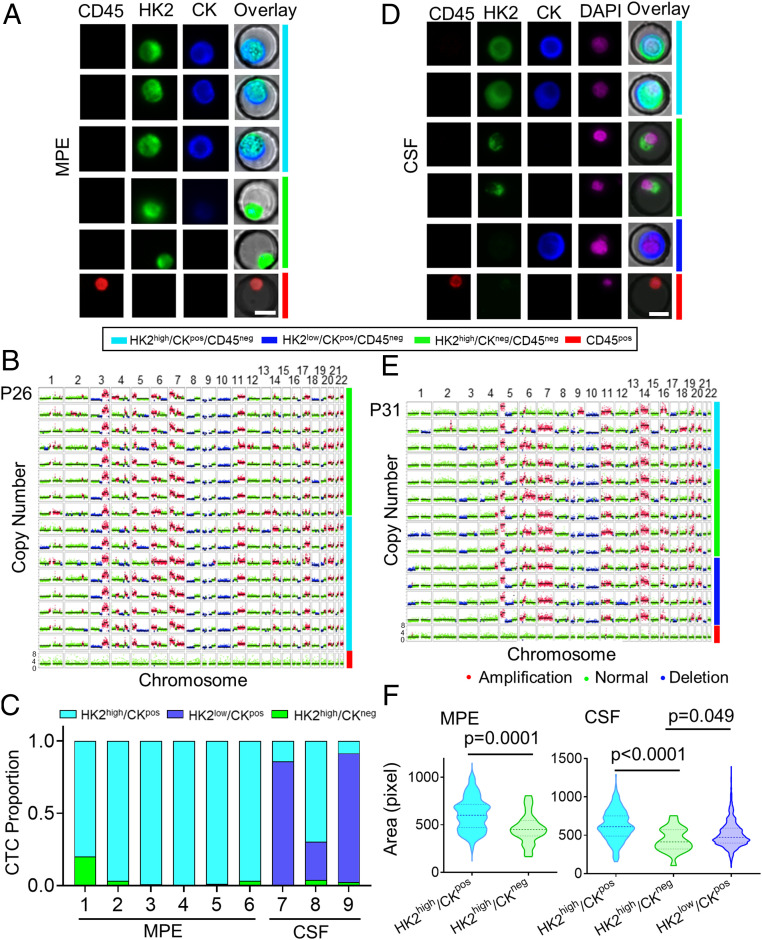
Fig. 3.
Identification and characterization of disseminated tumor cells in the MPE and CSF samples of LUAD patients. (A) Representative fluorescence images of tumor cells from an MPE sample of P26. Images are color coded by respective bars to the right with cell type annotations below. (B) Single-cell CNV profiles of randomly selected tumor cells and leukocytes from the MPE sample of P26. The cell subtypes are color coded to the right in the same way as A. (C) Tumor cell subtype proportions across all the MPE and CSF samples. (D) Representative fluorescence images of tumor cells from a CSF sample of P31. Images are color coded by respective bars to the right with cell type annotations below. (E) Single-cell CNV profiles of randomly selected tumor cells and leukocytes from the CSF sample of P31. The cell subtypes are color coded to the right in the same way as D. (F) Comparison of cell sizes between HK2high/CKpos and HK2high/CKneg tumor cells in the MPE sample (Left, n = 100 and 25, respectively) and HK2high/CKpos, HK2high/CKneg, and HK2low/CKpos tumor cells in the CSF sample (Right, n = 258, 22, and 1,498, respectively). The dashed and dotted lines of each violin plot denote the median and first and third quartiles, respectively.

