Fig. 1.
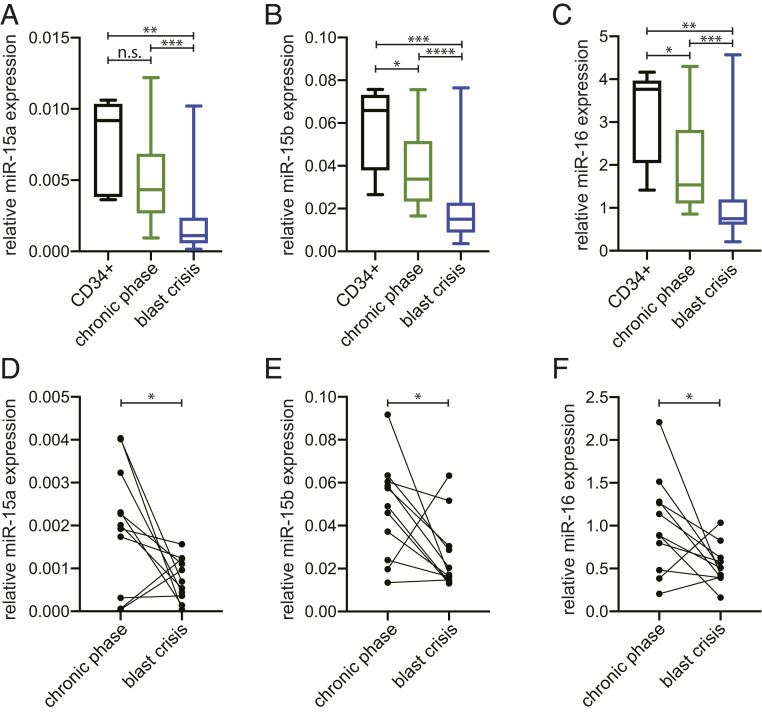
MiR-15/16 cluster expression in CML patients. MicroRNAs expression by qRT-PCR in CD34+ healthy controls and CML patients’ cells in CP (n = 17) and in BC (n = 22). Box plots of miR-15a (statistical analysis for all groups Kruskal–Wallis P value = 0.0005431) (A), miR-15b (statistical analysis for all groups Kruskal–Wallis P value = 8.292 × 10⁻⁵) (B), miR-16 (statistical analysis for all groups Kruskal–Wallis P value = 0.0003215) (C). (D–F) MicroRNAs expression by qRT-PCR of paired CML patients’ cells (n = 11) in CP and BC. Bipartite graph of miR-15a (one-way Wilcoxon signed-rank P value = 0.021) (D), miR-15b (one-way Wilcoxon signed-rank P value = 0.02686) (E), miR-16 (one-way Wilcoxon signed-rank P value = 0.01611) (F). n.s., not significant. *, 0.01< P value ≤ 0.05; **, 0.001 < P value ≤ 0.01; ***, 0.0001 < P value ≤ 0.001; ****P value ≤ 0.0001.

