Fig. 3.
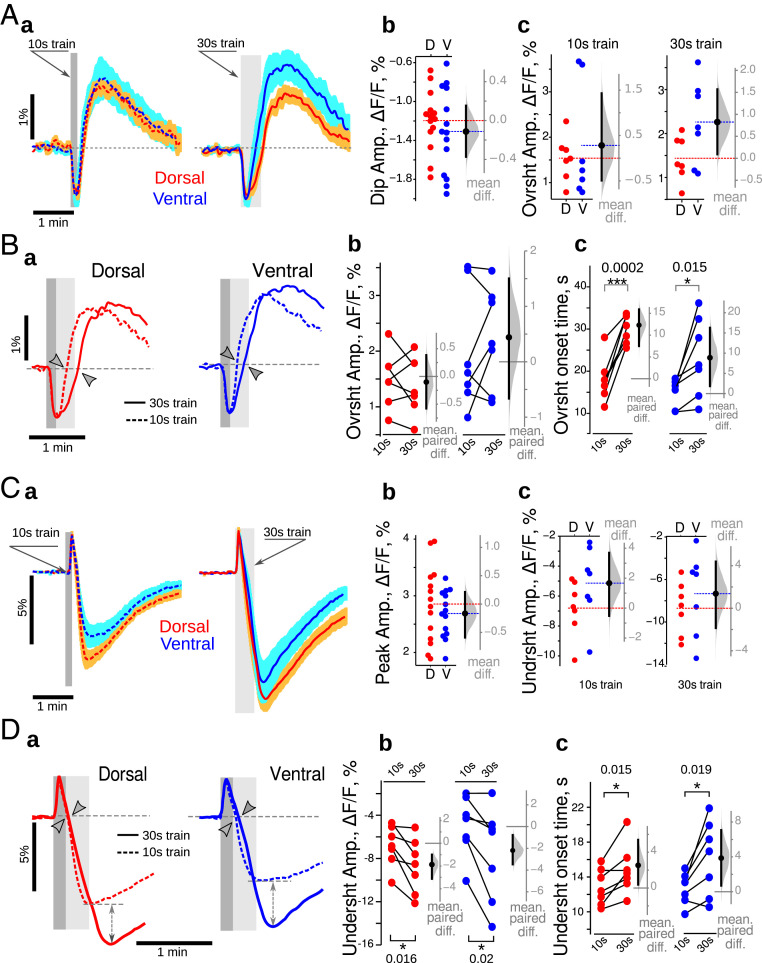
Loss of dorsoventral differences in epilepsy at ZT3. (A, a). The general time course of NAD(P)H was similar in DHS (red) and VHS (blue) in pilo mice for both 10 s (dashed lines) and 30 s (continuous lines) long trains. There was no difference in the amplitude of the oxidative dip (b) and overshoot (c) of NAD(P)H recorded in DHS (red circles) and VHS (blue circles). (B, a) In both DHS (red) and VHS (blue), the 30 s long stimulation delayed the onset of the overshoot (c) without affecting its amplitude (b). (C, a) The general time course of FAD+ was similar in DHS (red) and VHS (blue) in pilo mice for both 10 s (dashed lines) and 30 s (continuous lines) long trains. There was no difference in the amplitude of the oxidative peak (b) and undershoot (c) of FAD+ recorded in DHS (red circles) and VHS (blue circles). (D, a) In both DHS (red) and VHS (blue), the 30 s long stimulation delayed the onset of the undershoot (c) and increased its amplitude (b). On Aa and Ca, the averaged trace from seven independent experiments is displayed; for color code details, see Fig. 1 legend. Since the data set illustrated here passed the Shapiro–Francia normality test, the unpaired (A and C) and paired (B and D) t test were used. *P < 0.05, ***P < 0.001.

