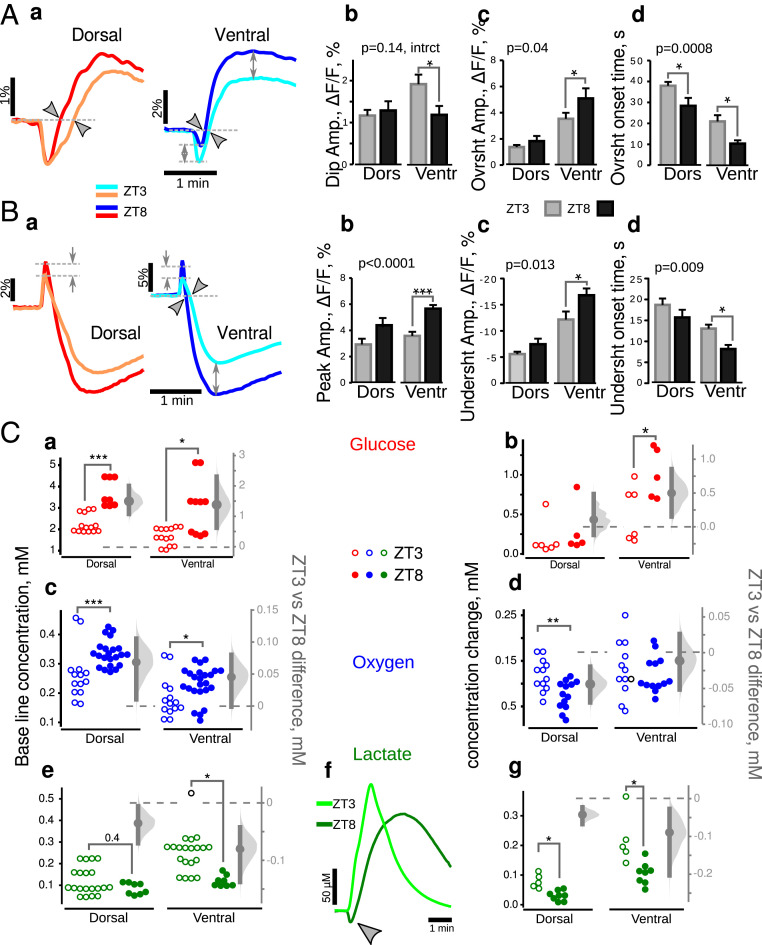
Fig. 8.
Dorsoventral and temporal dissociations in metabolism in control mice. (A, a) Averaged traces of NAD(P)H transients in DHS and VHS at ZT3 (light color traces) and ZT8 (dark color traces). (b) A two-way ANOVA showed an interaction between two factors, slice type and experimenting time, for dip amplitude (i.e., a different time regulation for DHS and VHS). The amplitude of overshoot (c) as well as its onset time (d) varied significantly with time in both slice types (P values in the top left corners of c and d). The Bonferroni corrected post hoc t test revealed that all three parameters describing NAD(P)H transients recorded in ventral slices varied with time while only the overshoot onset was modified in dorsal (b through d asterisks). (B) FAD+ transients (a-averaged taces) show a higher oxidative peak (b), as well as a larger and earlier undershoot (c and d) at ZT8 (dark color traces and black bars) than at ZT3 (light color traces). Two-way ANOVA confirmed that all these three parameters varied with ZT (P values in the top left corners of b–d), but this variability was significant in ventral slices only (asterisks). (C) Comparison of glucose, oxygen, and lactate concentration in quiescent and stimulated slices made at ZT8 (closed circles) and ZT3 (open circles). In both types of slices, the resting state glucose (a) and oxygen (c) concentrations were larger at ZT8, suggesting a lower level of metabolic activity that was consistent with the lower lactate concentration (e). Under stimulation conditions, glucose consumption did not vary (b) in dorsal slices. However, oxygen consumption (d) and lactate release (g) were lower at ZT8. In VHS, glucose consumption (b) was increased while lactate release (g) was decreased, probably due to lactate consumption as revealed with the concentration dip observed at the beginning of synaptic stimulation (f, gray arrowhead). Since experimental data on C were not normally distributed, we used the M-W test. *P < 0.05, **P < 0.01, ***P < 0.001.

