Fig. 6.
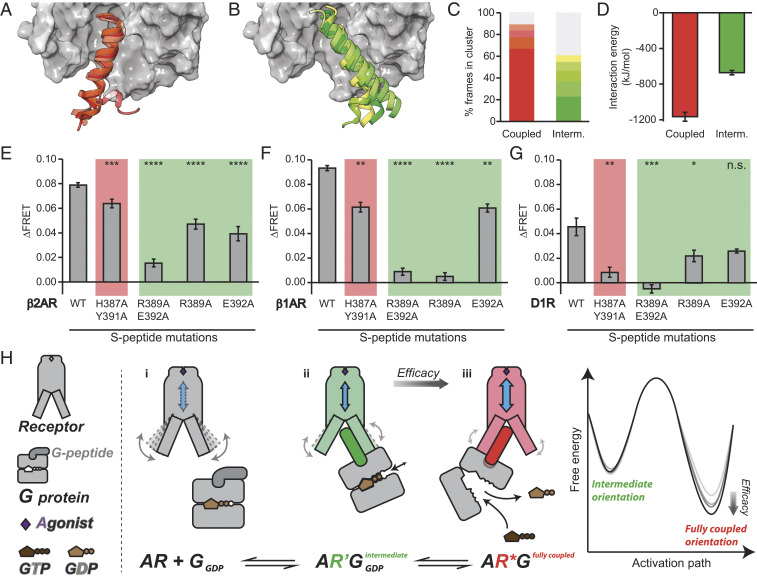
The β2AR/Gαs interaction in the intermediate orientation is weak but crucial. (A and B) The entire 4 μs MD ensembles of the fully coupled (A) and intermediate (B) orientations bound to Iso were aligned on the transmembrane helix backbone and rmsd clustered based on the backbone atoms of residues 377 to 389 (1.5 Å cutoff). The centroid of S-peptide clusters with greater than 5% occupancy are shown as ribbons with β2AR shown as surface representation in gray. Displayed residues are 372 to 394; unstructured residues 368 to 371 were removed for clarity. (C) Relative population of clusters (number of frames in each cluster divided by the total number of simulated frames, 50,000). The topmost populated clusters with greater than 5% occupancy are colored in red (fully coupled) or green (intermediate), following the color scheme in A and B. The remaining clusters are colored in gray. (D) Intermolecular β2AR-Spep interaction energy was calculated over S-peptide residues 368 to 394 based on MD. Iso was the bound ligand for both fully coupled and intermediate datasets. Each data point was derived from the last 100 ns of eight replicates. (E–G) Change in ΔFRET following Iso stimulation in GPMVs expressing β2AR (E), β1AR (F), and D1R (G) S-peptide sensors of WT or mutants previously reported from crystal structures as unique for the fully coupled (3SN6, red background) or intermediate (6E67, green background) orientations. (H) A schematic of the proposed model for the engagement and activation of G proteins by an agonist-stimulated GPCR. (i) Agonist binding enhances receptor conformational dynamics; (ii) G protein initially engages receptor with G-peptide in an intermediate orientation (green G-peptide) that in turn alters the receptor conformational landscape (highlighted in green); and (iii) G protein engages receptor with G-peptide in a fully coupled orientation (red G-peptide) with strong allosteric coupling with the agonist-binding site (blue arrow denotes allosteric coupling; receptor conformation is highlighted in red). Free energy diagram depicts ligand molecular efficacy being tuned by the strength and stability of the interaction in the fully coupled orientation. Error bar denotes SEM. Data are derived from at least three independent experiments (at least three separate GPMV preparations). A Student’s t test was performed to evaluate significance between WT and mutant conditions. *P ≤ 0.05; **P ≤ 0.01; ***P ≤ 0.001; ****P ≤ 0.000. n.s., nonsignificant.

