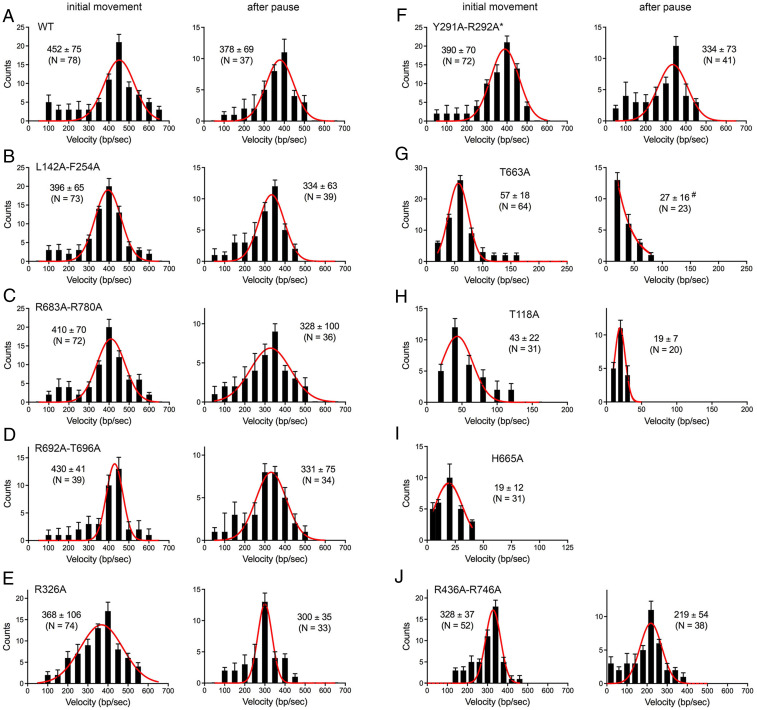
Fig. 6.
Single-molecule DNA curtain analysis of DSB resection velocity by AdnAB mutants. Velocity distributions of individual resection tracts are shown for WT AdnAB (A) and the indicated AdnAB mutants (B–J). For each AdnAB protein, we plotted separately the distribution of velocities at which AdnAB resected from the original end of the phage DNA (initial movement, graphs at left in each panel) and, for those events entailing pausing and resumption of resection after a transient pause, the velocity of movement after a pause (graph at right in each panel). Black error bars represent 95% confidence intervals calculated from bootstrap analysis. The solid red lines represent Gaussian fits to the data. The number of events scored (N) and mean velocities (± SD) derived from the Gaussian fit are shown in each graph (except for G, where the postpause mean velocity, denoted by #, was calculated from the scatter plot data shown in Fig. 7A).

