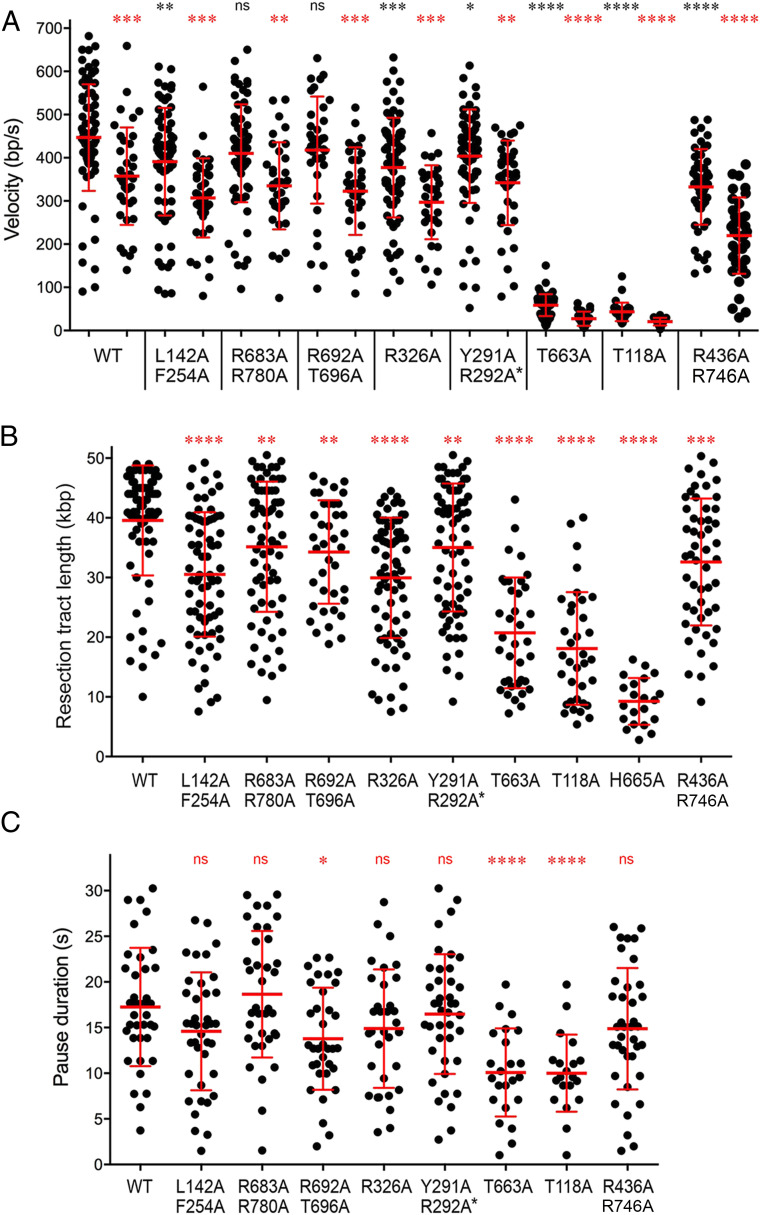
Fig. 7.
Summary of AdnAB mutational effects on single-molecule DNA resection. (A) Scatter plots of resection velocities during initial movement and after pausing. For each AdnAB protein specified below the x axis, the initial movement velocities are plotted on the left, and the postpausing velocities are plotted on the right. Red lines indicate the mean ± SD. Black asterisks above each initial movement scatter plot summarize the P values of unpaired t tests of mutant versus WT initial movement velocities. Red asterisks above each postpause scatter plot summarize the P values of unpaired t tests of postpause versus initial movement for each AdnAB enzyme. (B) Resection tract length. Scatter plots of total DNA resection tract lengths. The observation period was 20–25 min for slow-velocity mutants T663A, T118A, and H665A. All other AdnAB proteins were observed for 5–7 min. Red lines indicate the mean ± SD. Red asterisks above each mutant scatter plot summarize the P values (unpaired t test of mutant versus WT). (C) Pause duration. Scatter plots of pause times between initial movement and resumption of resection. Red lines indicate the mean ± SD. Red asterisks above each mutant scatter plot summarize the P values (unpaired t test of mutant versus WT). P value symbols: ****, P < 0.0001; ***, P < 0.001; **, P < 0.01; *, P < 0.05; ns, not significant.

