
Figure 5. Myeloid changes within the tumor microenvironment identified by high-dimensional single-cell analysis following cabozantinib or cabozantinib and anti-IL1β treatment.
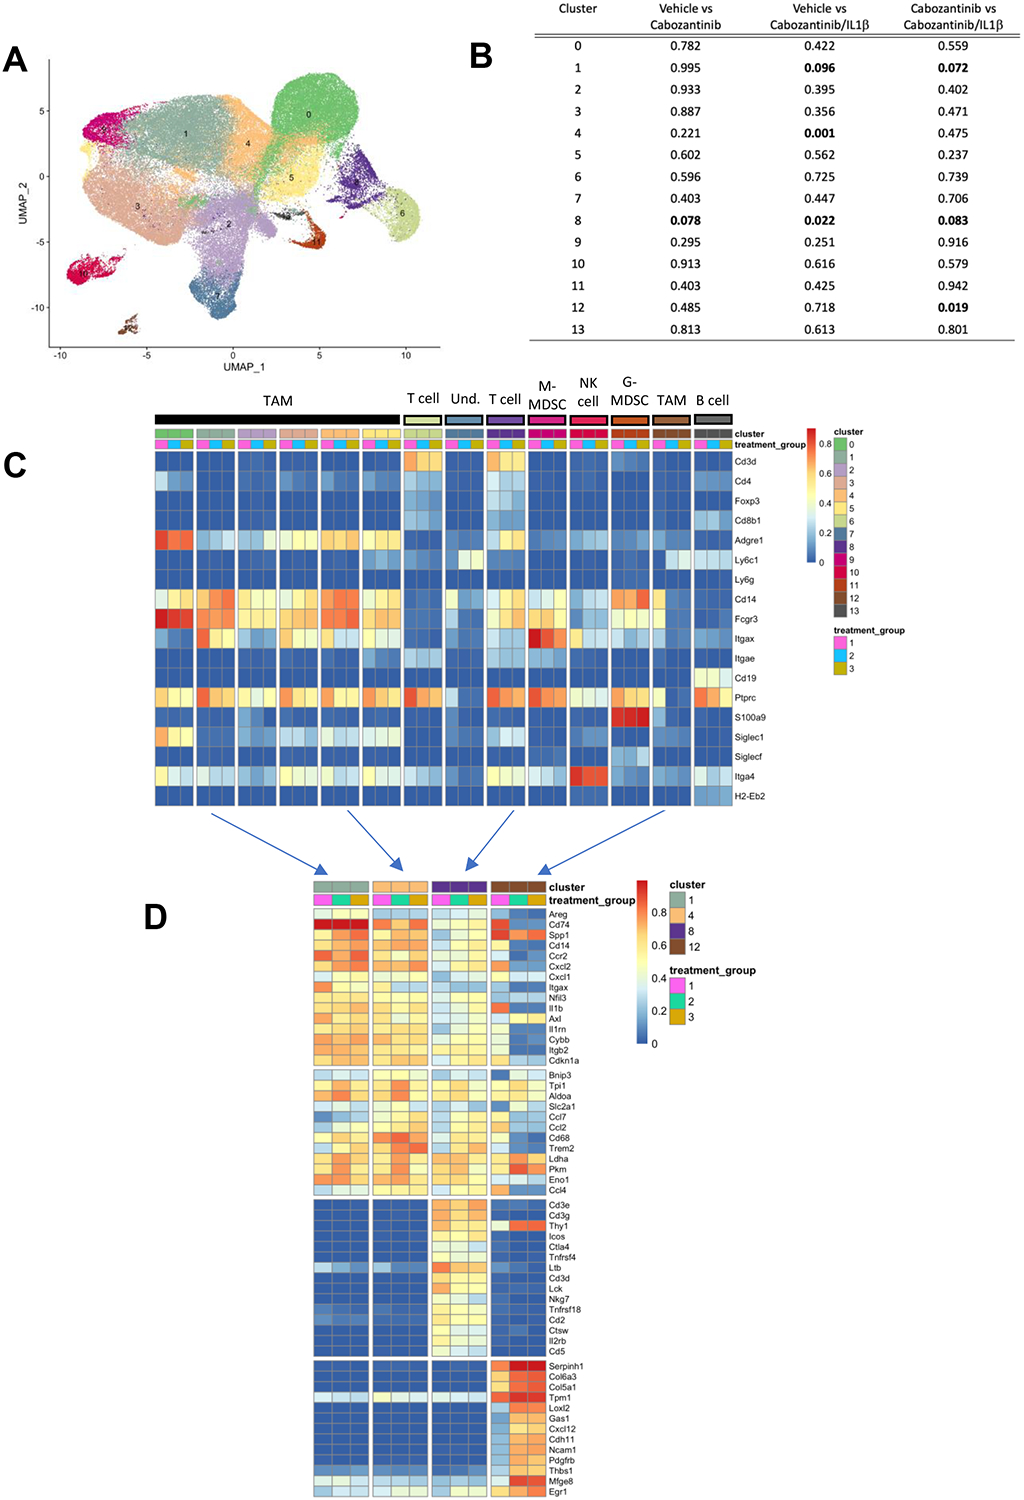
A). Clustering of sorted CD45+ intratumoral immune cells visualized by UMAP from 9 tumors (3 vehicle, 3 cabozantinib, and 3 cabozantinib/IL1B treated tumors) reveals distinct immune cell populations. B) Gene expression profiles of select genes identify distinct immune cell clusters. C) Gene expression profiles across treatment groups. Clusters 6 and 8 express T cell specific genes. Treatment group 1 = vehicle, Treatment group 2 = cabozantinib, Treatment group 3 = Cabozantinib + IL1B. Clusters 0–5, 7, 9–12 correspond to myeloid cells within the TME. D) Top 10 to 15 differentially expressed genes in clusters 1, 8, and 12 from single-cell RNAseq. (n=3 tumors/group from each treatment group).