
Figure 6. Myeloid changes within the tumor microenvironment following combination anti-interleukin-1 beta immunotherapy.
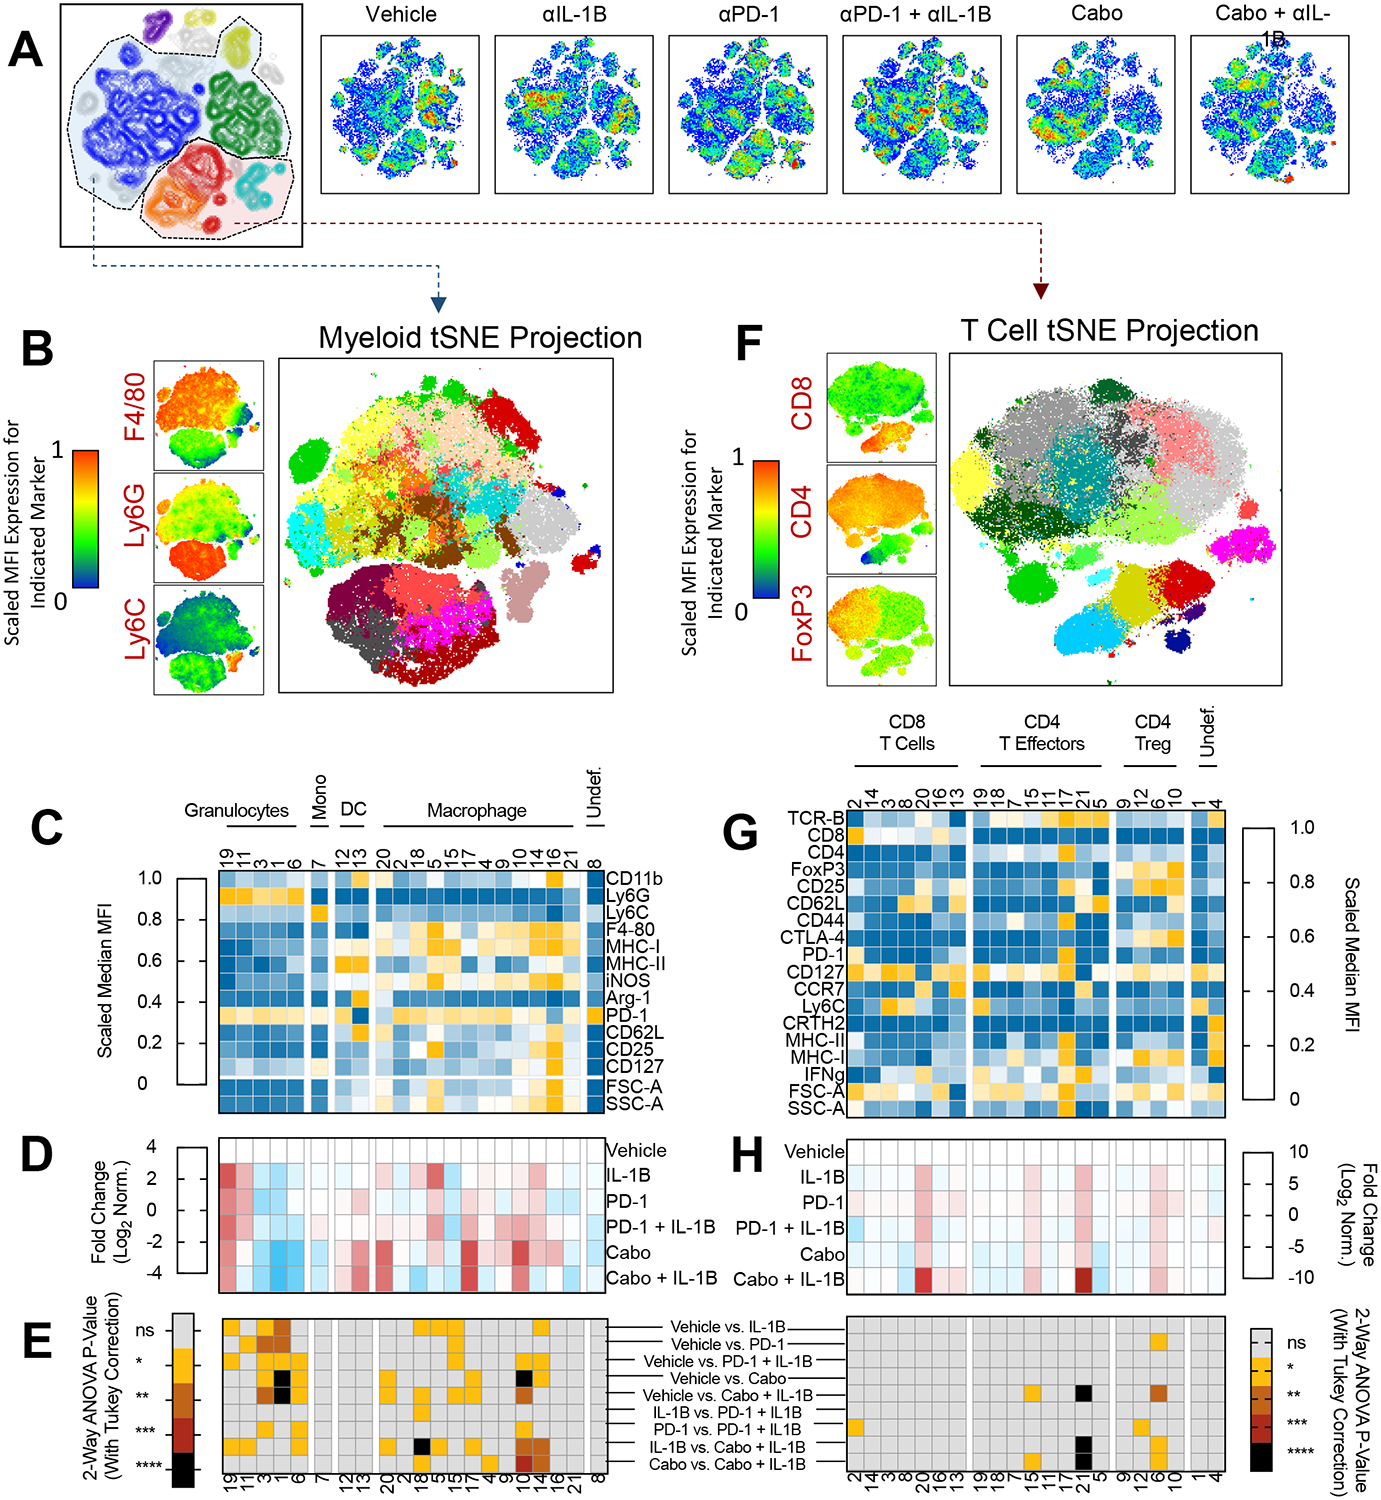
A). TSNE clustering of CD45+ immune cells from spectral cytometry (n= 8–10 mice/group). Cell Density plots shows for each treatment group (blue is low density, red is highest density) B) Phenograph clustering of intratumoral myeloid cell populations for all mice across treatment groups. Representative marker expression for F4/80, Ly6G, and F4/80 at left and myeloid TSNE projection showing 21 clusters (right). C) Relative MFI for each myeloid marker across phenograph clusters. D) Fold–change of myeloid cluster frequency by treatment group. E) 2-way ANOVA of select treatment groups with Tukey correction to show statistically significant changes in cluster frequency. Treatment group comparisons are as indicated at right. F) Phenograph clustering of intratumoral lymphoid populations for all mice across treatment groups. Representative marker expression for CD4, CD8, and FoxP3 at left and T cell specific TSNE projection showing 21 clusters (right). G) Relative frequency for each marker across phonograph clusters. H) Fold-change of lymphoid cluster frequency by treatment group. E) (at right) 2-way ANOVA of select treatment groups with Tukey correction to show statistically significant changes in cluster frequency. * P < 0.05, ** P < 0.01, *** P < 0.001, **** P < 0.0001