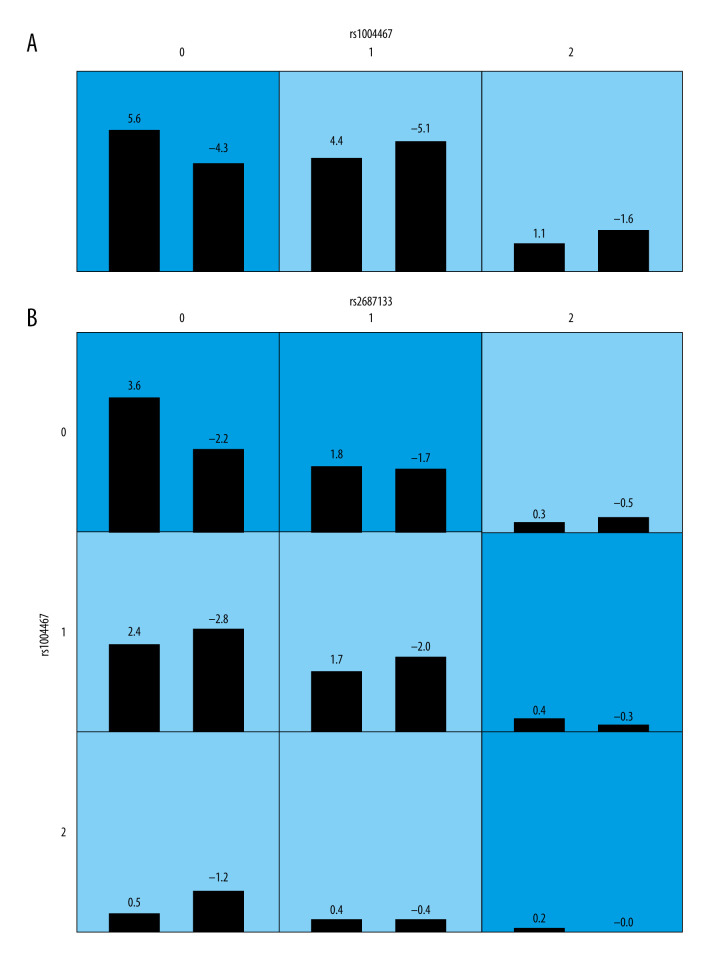
Figure 3.
Single-nucleotide polymorphism (SNP) interaction graphs analyzed by generalized multifactor dimensionality reduction for second-to-fourth digit ratio (2D: 4D). (A, B) Optimal models as determined by generalized multifactor dimensionality reduction (GMDR) for CYP SNPs (0 = 0 minor allele; 1=1 minor allele; 2=2 minor alleles). The numbers within each small square represent positive scores (left) and negative scores (right). For each square, dark blu cells indicate the high effect on the 2D: 4D, and light blue cells represent the low effect on the 2D: 4D. The test was adjusted for sex.

