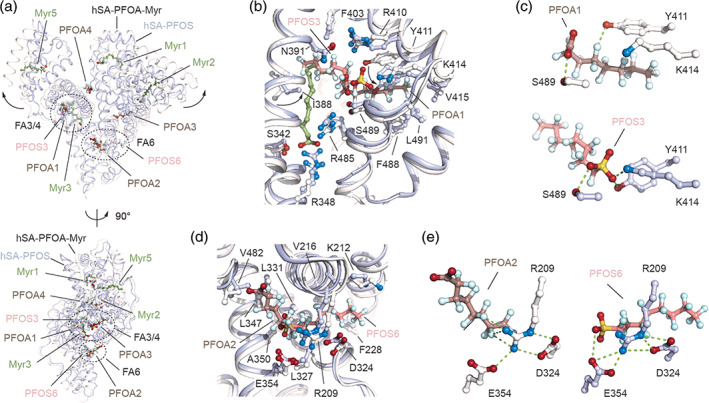
FIGURE 3.

Structural comparison of the ligand binding modes of PFOA and PFOS to hSA. (a) The superimposed hSA‐PFOA‐Myr (white/dark salmon/smudge green) and hSA‐PFOS (blue white/salmon; PDB identification code 4E99) complexes are shown in two orientations (90° rotation); (b) Detailed view of the superimposed PFOA1 and PFOS3 molecules bound to FA4 in sub‐domain IIIA of hSA; (c) Comparison of polar interaction network formed by PFOA1 (top) and PFOS3 (bottom) molecules bound to FA4; (d) Detailed view of the superimposed PFOA2 and PFOS6 molecules bound to FA6 in domain II hSA; (e) Comparison of polar interaction network formed by PFOA2 (left) and PFOS6 (right) molecules bound to FA6. The α‐helices of hSA in complex with PFOA and PFOS are represented by ribbon diagram and shown in white and light blue, respectively. The selected amino acid side chains are represented as ball‐and‐stick and colored by atom type (carbon = white for hSA/PFOA/Myr complex and blue white for hSA/PFOS complex, oxygen = firebrick, nitrogen = skyblue). Bound PFOA, PFOS and Myr are shown in a ball‐and‐stick representation and colored by atom type (PFOA: carbon = dark salmon, oxygen = firebrick, fluorine = pale cyan; PFOS: carbon = salmon, oxygen = firebrick, fluorine = pale cyan, sulfur = yellow orange; Myr: carbon = smudge green, oxygen = firebrick). For visualization, only inter‐molecular polar interactions below 3.0 Å are shown
