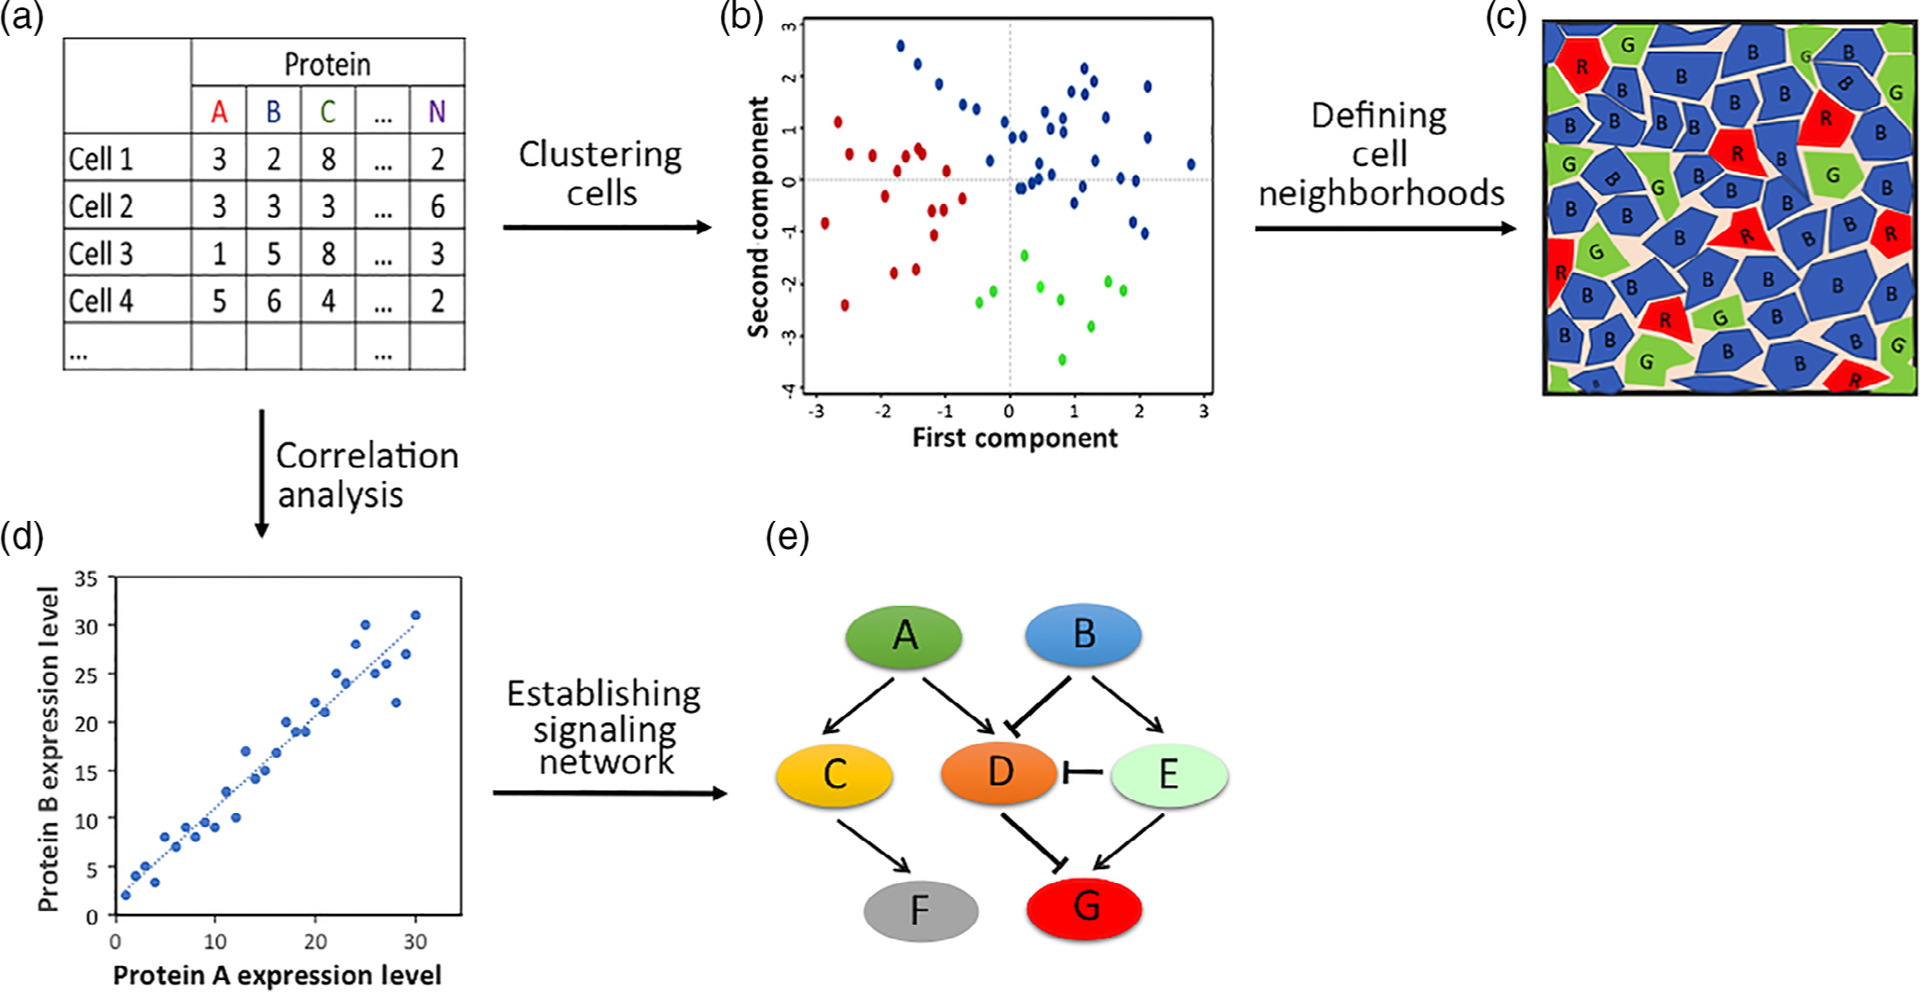
FIGURE 10.

(a) A large number of proteins are quantified in every single cells of a biological system. (b) Heterogeneous cells are partitioned into different subgroups, with each subgroup consisting of cells possessing similar protein expression profiles. (c) Specific cell neighborhoods with unique cell subgroup compositions are identified. (d) Pairwise protein expression correlation analysis is carried out with each spot presenting one cell and its protein expression levels shown in x and y axes. (e) A regulatory network is generated with activating and inhibitory interactions
