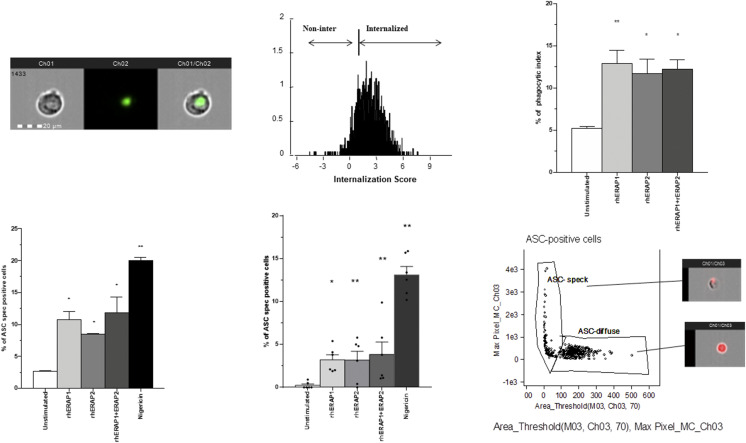
FIGURE 2.
rhERAPs stimulation resulted into increased phagocytosis in THP-1–derived macrophages into inflammasome ASC speck assembly. (A) Representative images captured by Amnis FlowSight Cytometry of THP-1–derived macrophage incubated with latex beads rabbit IgG–FITC complex are shown. The first column shows BF image of macrophages incubated with latex beads rabbit IgG–FITC complex, the second column shows image related to latex beads rabbit IgG–FITC complex FL, and the third column shows merged latex beads rabbit IgG–FITC complex FL with BF (left); IS calculated on latex beads rabbit IgG–FITC complex positive macrophage by IDEAS software is shown (right). Scale bar, 20 μm. (B) THP-1–derived macrophages were incubated with or without 100 ng/ml of rhERAP1, rhERAP2, or rhERAP1+rhERAP2 for 3 h. Latex beads rabbit IgG–FITC complex was added directly to the culture medium at a 1:200 dilution and incubated at 37°C for 2 h and immediately analyzed by FlowSight Amnis. The phagocytic activity of THP-1–derived macrophages incubated in the absence of rhERAPs treatment was measured as a control (C–E). NLRP3/ASC speck colocalization was analyzed by Amnis FlowSight Cytometry. 1 × 10⁶ LPS-primed (1 μg/ml) THP-1–derived macrophages (C) and PBMCs (six HCs) (D) were stimulated for 24 h with rhERAP1, rhERAP2, or rhERAP1+rhERAP2 (100 ng/ml), and results were summarized as the percentage of positive cells for NLRP3/ASC speck formation. (E) Representative image of nigericin-stimulated THP-1–derived macrophage identifying ASC speck. ASC-positive cells are plotted on Max Pixel MC (Ch03) versus area threshold (M03, Ch03, and Ch70) scatter plot. This mask allows us to discriminate between cells characterized by speck formation, in which a functional inflammasome complex is assembled, and cells with an ASC diffuse pattern. Mean values and SEM are shown. *p < 0.05, **p < 0.01.

