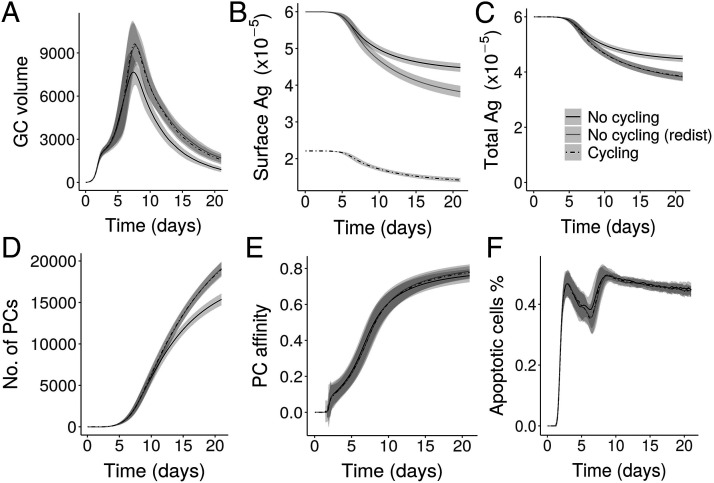
FIGURE 2.
GC simulations in the presence and absence of Ag cycling: (A) GC volume measured by number of GC B cells, (B) surface Ag amount of all FDCs in the GC, (C) total Ag amount including surface Ag and internalized Ag, (D) number of PCs produced, (E) PC affinity, and (F) percentage of apoptotic cells. In the labels shown in (C), No cycling (redist) represents simulations without Ag cycling (similar to No cycling) but includes surface redistribution of Ag. Ag amount is represented as number of Ag portions.

