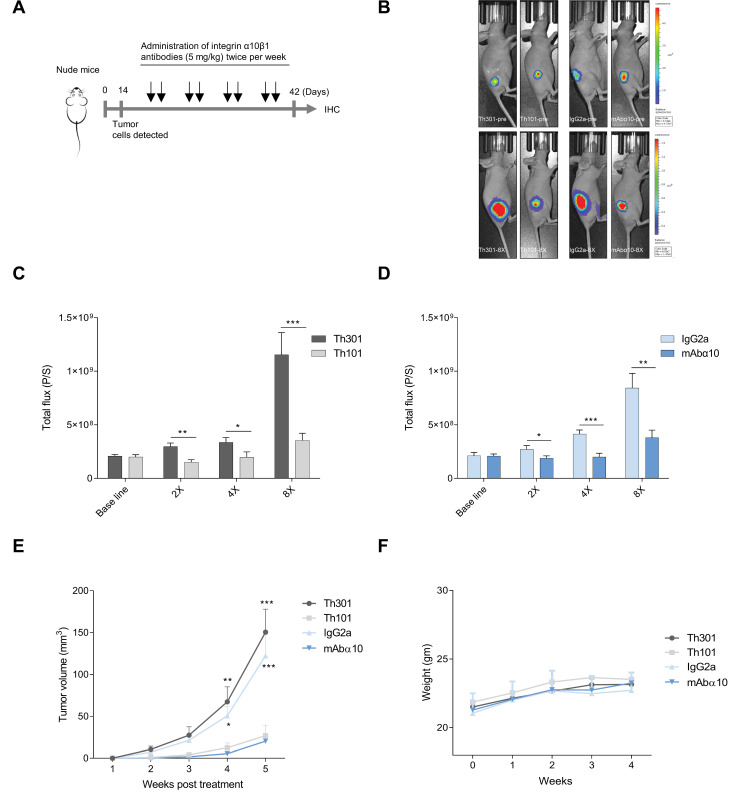
Figure 6.
Anti-tumor efficacy of integrin α10 antibodies on xenograft glioblastoma in mice. (A) A schematic presentation of the in vivo experiment. (B) Photographic and 2D bioluminescence overlay images from representative mice from each treatment group before (Top) and after (Lower) treatment onset. The growth of U3054MG xenograft tumors treated with the integrin antibodies Th101 (C) and mAbα10 (D), and the control antibody Th301 and IgG2a. A total of 2 × 10⁶ U3054MG cells were injected subcutaneously into the right flank. After treatment onset, tumor progression in nude mice was monitored by luciferase live imaging weekly. The 2D bioluminescence signal measured as total flux (P/S) from each mouse was collected to evaluate tumor sizes of the Th101 and mAbα10-treatment groups as well as the Th301 and IgG2a-treatment groups. The data show the mean total flux (P/S) of all animals in each group at the indicated time point ± SE. The Mann–Whitney test was used to compare the difference between α10 antibody and control antibody and each treatment time point where * p < 0.05; ** p < 0.01; and *** p < 0.001. (E) The tumor size (mm3) in mice was measured by Vernier calipers during the treatment time. The two-way ANOVA test followed by Bonferroni’s multiple comparison test was applied. Four levels of significance were used for a 95% confidence interval, where * p < 0.05; ** p < 0.01; and *** p < 0.001. (F) Whole-body weight (gm) of the mice in each group measured over 4 weeks. Data are expressed as mean ± SE.

