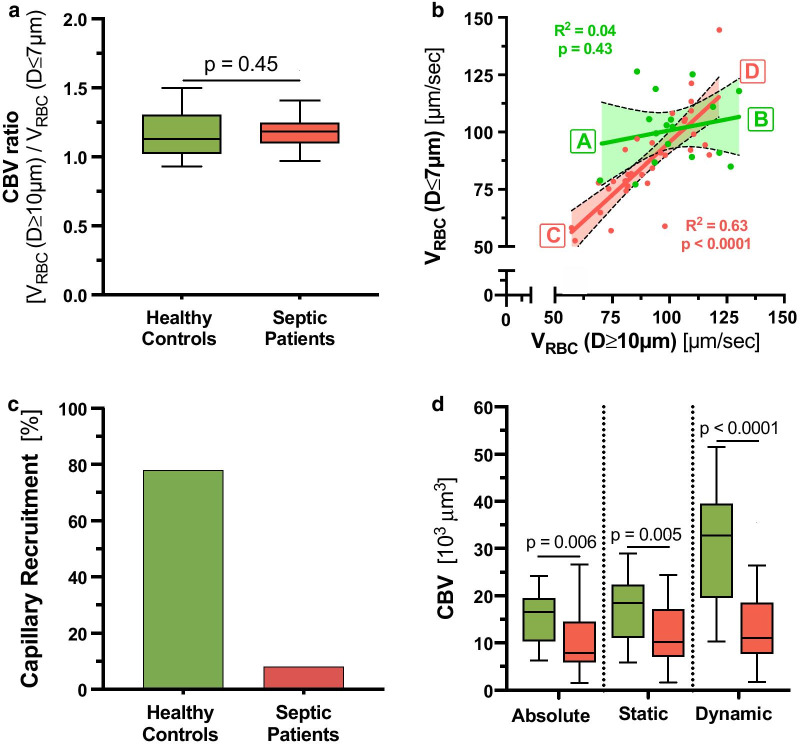
Fig. 3.
Derivation of capillary recruitment and dynamic capillary blood volume. a Box plots showing capillary blood volume (CBV) ratio in healthy controls (green) and sepsis patients (red). CBV ratio denotes the RBC velocity (VRBC) in feed vessels (D ≥ 10 µm) over VRBC in capillaries (D ≤ 7 µm). b Scatter dot plots and simple linear regression (slope) with 95% confidence intervals of VRBC in capillaries (D ≤ 7 µm) plotted against VRBC in feed vessels (D ≥ 10 µm). Different states at the ends of the slope lines (indicated by green/red bold letters A-D) are further explained in Fig. 5. c Bar charts showing the capillary recruitment (CR), defined as 1 − slope (VRBC (D ≤ 7 µm) vs. VRBC (D ≥ 10 µm)) per group. d Box plots showing the development of different measures and estimates of CBV. Left: CBVabsolute is determined from the number of capillary segments multiplied by capillary segment length (i.e., capillary density (mm/mm2)) and segment-specific capillary cross-sectional area (π * radius2). Briefly, as each vascular segment can be considered a cylinder, the segment-specific capillary cross-sectional area can be calculated with the mathematical type π * radius2 (circle’s area). The radius is estimated every 10 µm (segment’s length) and recorded accordingly. Middle: CBVstatic is calculated as CBVabsolute * VRBC (D ≥ 10 µm)/VRBC (D ≤ 7 µm). Right: CBVdynamic is defined as CBVstatic * (1 + CR). RBC red blood cell, CBV capillary blood volume, CR capillary recruitment, D diameter, V velocity

