Fig. 1.
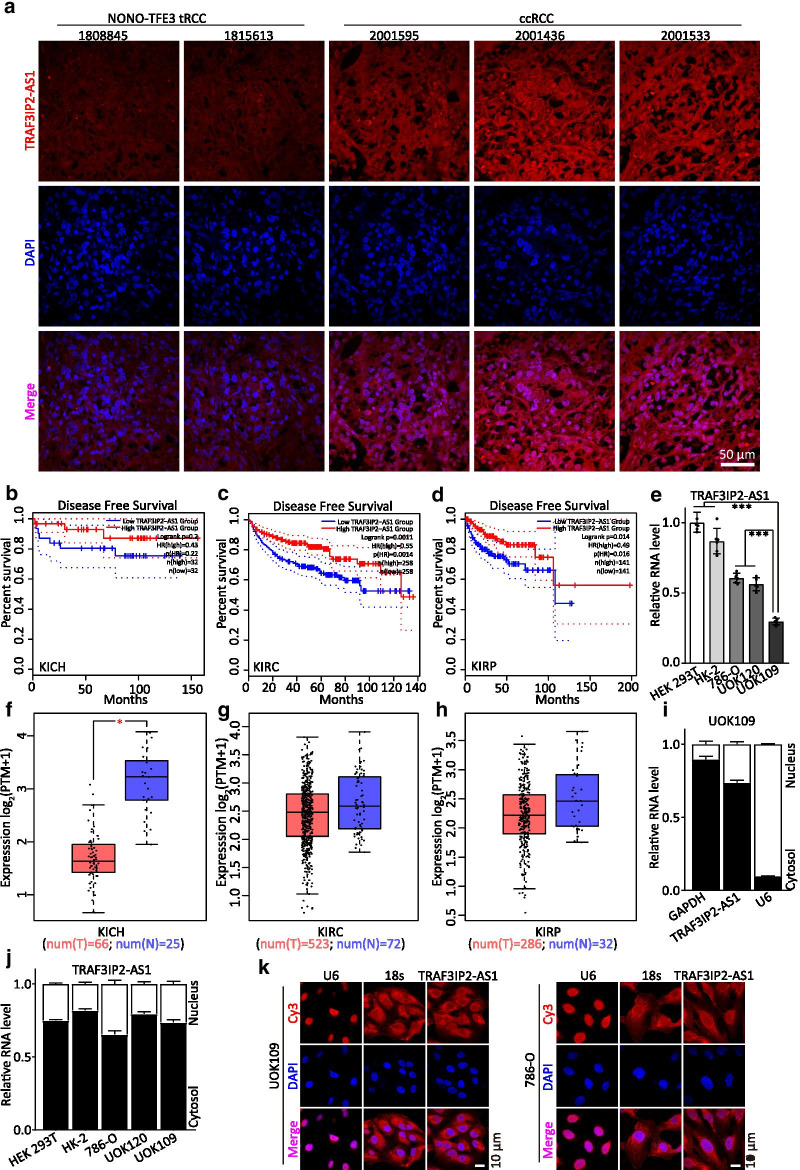
TRAF3IP2-AS1 expression is significantly decreased in NONO-TFE3 tRCC. a The RNA level of TRAF3IP2-AS1 (red) was analyzed by FISH assays in NONO-TFE3 tRCC and ccRCC. DAPI-stained nuclei are blue. b–d Kaplan–Meier analysis revealed the disease-free survival (DFS) in KICH, KIRC and KIRP patients based on the relative TRAF3IP2-AS1 expression. e The RNA level of TRAF3IP2-AS1 was analyzed by qRT-PCR assay in ccRCC cell line (786-O), tRCC cell lines (UOK109 and UOK120) and normal cell lines (HK-2 and HEK293T). f–h Analysis of TRAF3IP2-AS1 in KICH, KIRC and KIRP tissues compared with normal tissues were performed using TCGA data. i–j The subcellular distribution of TRAF3IP2-AS1 was analyzed via qRT-PCR in HEK293T, HK-2, 786-O, UOK120 and UOK109 cells. U6 and GAPDH were used as nuclear and cytoplasmic markers, respectively. k The location of TRAF3IP2-AS1 (red) in UOK109 and 786-O cells was determined by FISH assay. U6 and 18s rRNA were used as positive controls for the nuclear and cytoplasmic fractions, respectively. DAPI-stained nuclei are blue. The data are presented as the mean ± SD, *P < 0.05, ***P < 0.001

