Fig. 3.
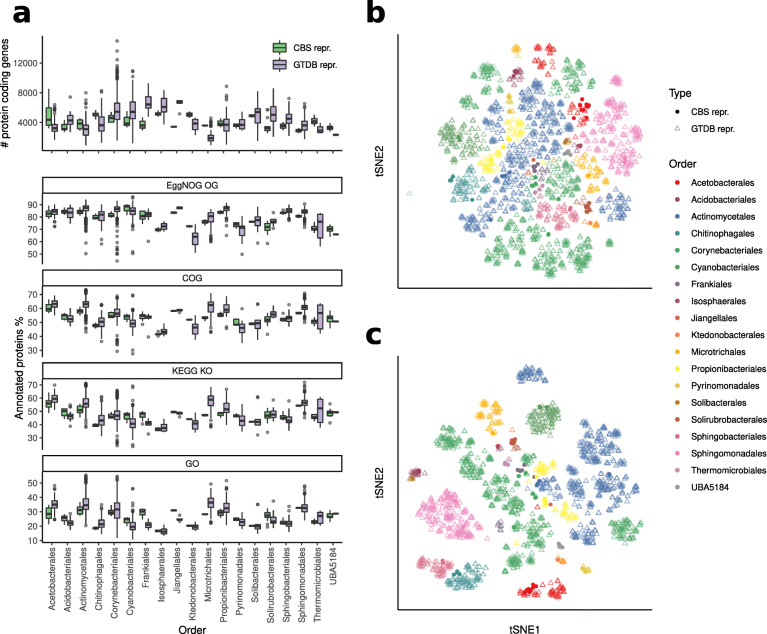
a Upper panel: number of protein coding genes in the CBS representatives compared to the reference genomes from the same order; lower panels: fraction of protein coding genes with homologs in EggNOG OGs, COGs, KEGG KOs, and GO. Starting from the Jaccard distances between the protein cluster profiles, b or the functional profiles (c), the t-SNE (t-distributed stochastic neighbor embedding) dimensionality reduction highlights the separation between genomes from different orders. Only HQ CBS representative genomes were considered in this analysis

