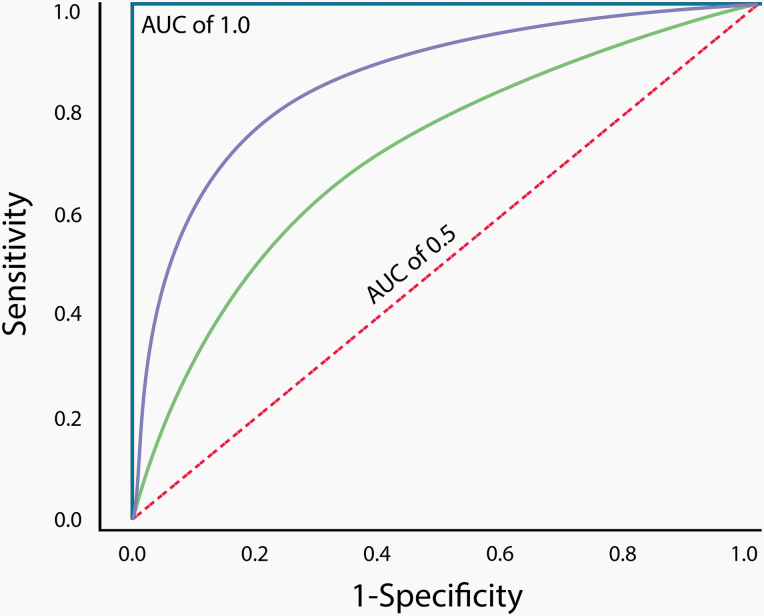
Figure 2.
Receiver operating characteristic curve. A perfect classifier with an area under the curve (AUC) of 1.0 is represented by the solid blue line, and a random classifier with an AUC of 0.5 is represented by the dashed red line. The classifier represented by the solid purple line has better discriminatory accuracy than the classifier represented by the solid green line, since its AUC is closer to 1.0.

