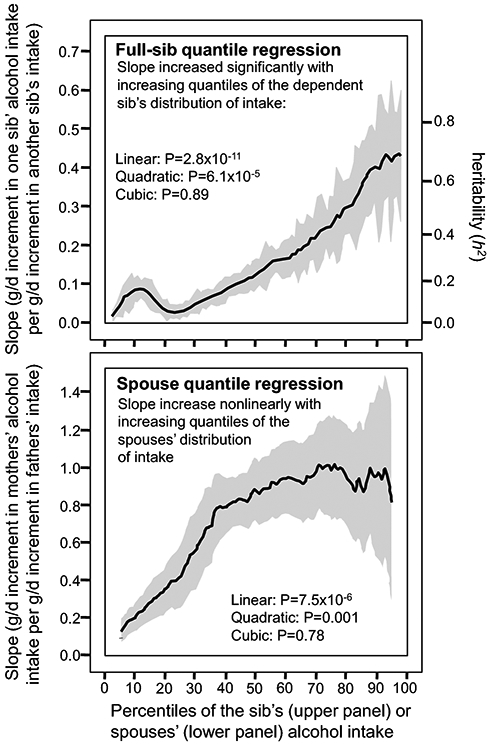
Figure 2.

Full-sib regression slopes (vertical axis) by quantiles of the sib’s alcohol intake (horizontal axis, upper panel), and spouse regression slope of the mother (dependent variable) vs. father (independent variable, vertical axis) by quantiles of the mother’s alcohol intake (horizontal axis, lower panel). Shaded region designates the 95% confidence interval for the quantile-specific slopes. Spouse and sibling reported alcohol intake (g/d) adjusted for sex, age, age2, sex x age, and sex x age2.
