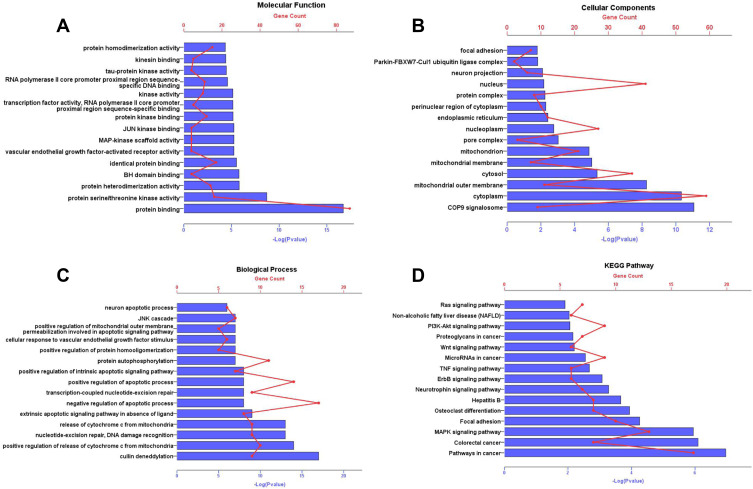
Figure 4.
GO annotation and KEGG pathway enrichment analysis for associated human proteins that directly or indirectly interacted with common targets. The y-axis shows significantly enriched Molecular Function, Cellular Components, Biological Process, KEGG pathways of the targets. The x-axis shows the enrichment scores of these terms or the counts of targets. P value<0.01. (A) Molecular Function; (B) Cellular Components; (C) Biological Process; (D) KEGG pathways.
Abbreviations: GO, gene ontology; KEGG, Kyoto Encyclopedia of Genes and Genomes.

