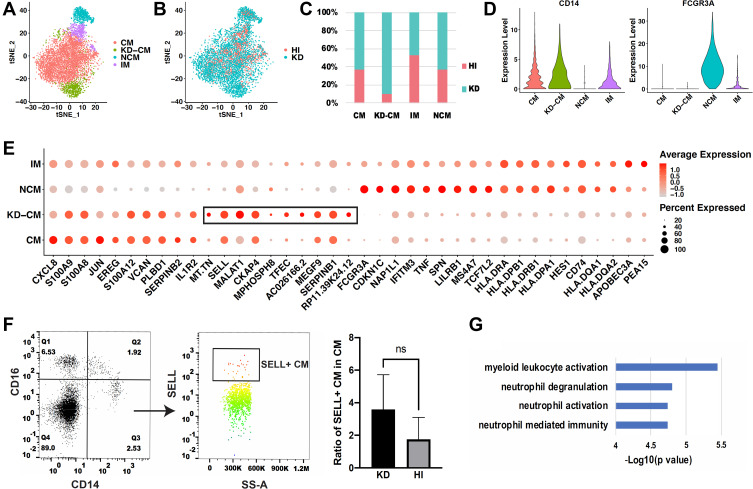
Figure 4.
Comparison of monocyte subsets between healthy and KD infants. (A) t-SNE plot of monocyte subsets in healthy and KD infants. (B) t-SNE plot of monocyte subsets distributed in healthy infants and KD patients. Red dots represent monocytes from healthy infants and turquoise dots represent monocytes from KD patients. (C) Proportion of healthy and KD monocytes in each subset. (D) Classical markers of 4 subsets shown in violin plot. Y-axis demonstrates the normalized UMI counts. (E) Dot plot showing proportion of cells in each subset expressing marker genes (dot size), and average expression (color scale). KD-CM was featured by the marker genes in the black box. (F) Flow cytometry analysis of SELL+ CM fraction in healthy and KD infants. The left dot plots represent gating method of CM, and the right histogram represents statistical results. (n = 3, *p ˂ 0.05) (G) Gene functions of marker genes of KD-CM.
Abbreviations: HI, healthy infants; KD, KD patients; CM, classical monocytes; IM, intermediate monocytes; NCM, non-classical monocytes; KD-CM, CM of KD patients.

