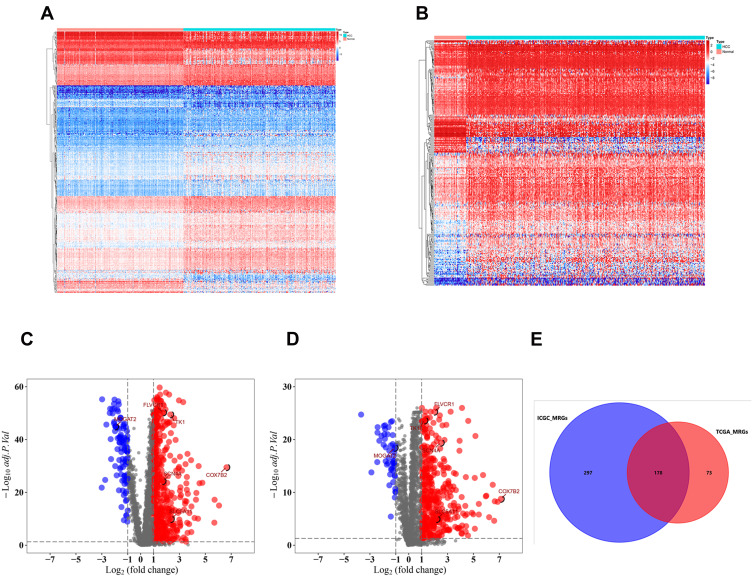
Figure 1.
Differentially expressed metabolism-related genes (MRGs) in hepatocellular carcinoma (HCC). Heatmap of MRGs between HCC and nontumor tissues in ICGC database (A) and TCGA database (B). The color from blue to red represents the progression from low expression to high expression; Volcano plot of MRGs in ICGC database (C) and TCGA database (D). The red dots in the plot represents upregulated genes and blue dots represents downregulated genes with statistical significance. Black dots represent no differentially expressed genes. (E) Venn diagram showing the gene numbers of the MRGs of HCC in ICGC and TCGA database.

