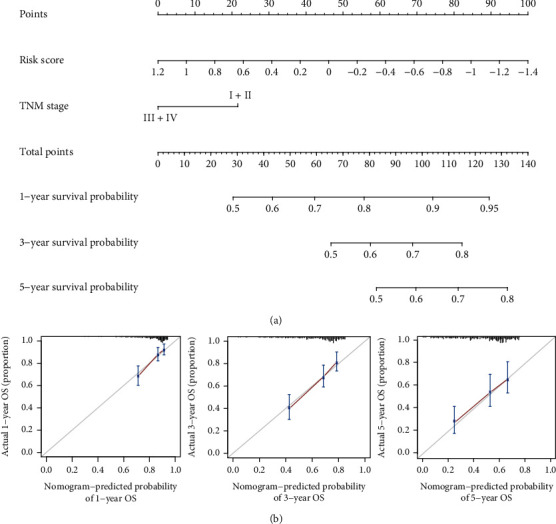
Figure 6.

The established nomogram exhibited good predictive ability. This nomogram was generated using a combination of risk scores and TNM stage to predict HCC patient OS (a). Calibration charts corresponding to the prediction of 1-, 3-, and 5-year survival in the training cohort. Horizontal and vertical axes, respectively, correspond to the predicted and actual survival probability (b).
