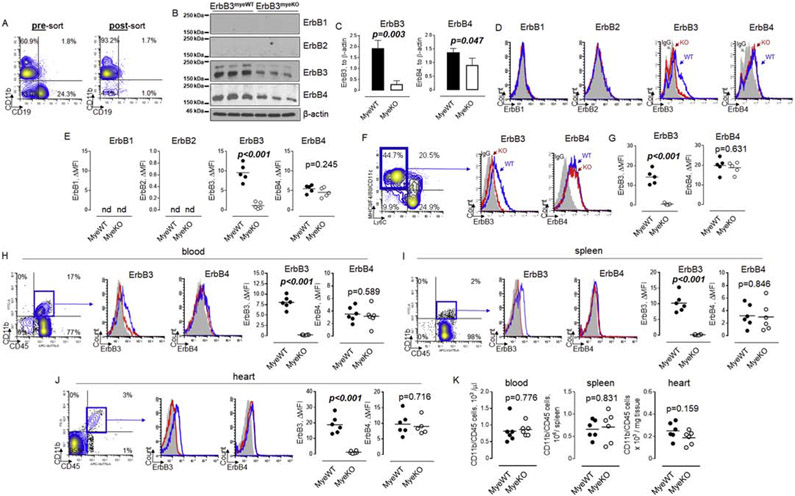
Figure 1. Number of myeloid cells are similar between ErbB3MyeWT and ErbB3MyeKO mice in steady-state conditions.
A. Bone marrow cells were isolated from femur and tibia bones (left and right legs) and used to isolate CD11b positive cells as described in Methods. Representative flow cytometry contour plots showing enrichment of CD11b cells after immunomagnetic separation. B. Western blot analysis of ErbB receptors protein expression in bone marrow CD11b cells obtained from wild type and ErbB3 knockout animals. The horizontal lines on the left are the molecular weight ladder. C. Graphical representation of data from western blot analysis of ErbB receptors expression in wild type (MyeWT, n=3) and myeloid cell-specific ErbB3 knockout (MyeKO, n=3) mice. Data are shown as mean±SEM, statistical significance calculated using unpaired t test. D. Representative flow cytometry histograms demonstrating cell surface expression of ErbB receptors in bone marrow CD11b cells. Shaded histograms – IgG control; open blue histograms – wild type mice; open red histograms – knockout animals. E. Graphical representation of flow cytometry data on ErbB receptors expression in bone marrow CD11b cells obtained from wild type (MyeWT, n=5) or ErbB3 knockout (MyeKO, n=5) mice, unpaired t test. F. Bone marrow Lin- hematopoietic progenitor cells were incubated in the presence of 20 ng/ml of GM-CSF for six days to generate proinflammatory macrophages (left contour plot, blue gate). Levels of ErbB3 (middle histogram) and ErbB4 (right histogram) were determined using flow cytometry. G. Data from flow cytometric analysis of cell surface expression of ErbB3 and ErbB4 on BM-derived macrophages generated in the presence of GM-CSF. H- J. Representative flow cytometry plots showing the percentage of CD11bposCD45pos myeloid cells (contour plots, left), expression of ErbB3 receptors (histograms, left), and ErbB4 (histograms, right) on myeloid cells in peripheral blood (H), spleen (I), and heart (J) of wild type (MyeWT, blue histograms) and ErbB3 knockout (MyeKO, red histograms) animals. Shaded histograms – IgG control. K. Data from flow cytometric analysis showing the number of myeloid cells in blood, spleen, and heart isolated from control mice (MyeWT, n=6) and myeloid cells-specific ErbB3 knockout (MyeKO, n=6) animals. Unpaired t test.

