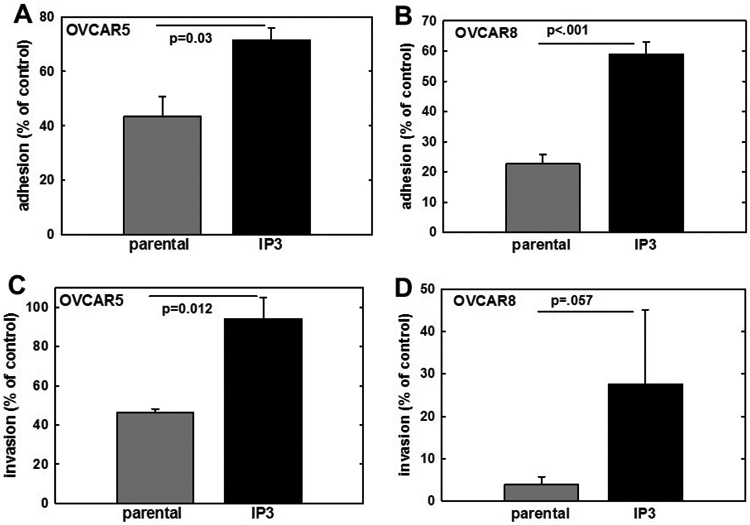
Figure 2. In vitro comparison of parental and IP3 cell lines.

(A, B) Analysis of adhesion. Parental OVCAR5 or OVCAR8, respectively, or their matched IP3 sublines were assayed for adhesion to type I collagen-coated wells. Cells (1x10⁵) were added to wells and allowed to adhere for 45 min, followed by washing to remove non-adherent cells and enumeration of adherent cells (minimum of 20 high-powered fields per condition). Adhesion is shown as % of control adhesion (24h time point). (C,D) Analysis of invasion. Parental OVCAR5 or OVCAR8, respectively, or their matched IP3 sublines, were assayed for invasive activity using a Boyden chamber (8-um pore) coated with Matrigel (10 ug). Cells (2x10⁵) were added to the chamber in serum-free medium for 24-72h. At the termination of the assay, non-invading cells were removed from the top of the filter using a cotton swab. Diff-Quik was used to fix and stain filters and migrating cells adherent to the bottom of the filter were enumerated by counting a minimum of 20 high-powered fields. All experiments were performed in at least triplicate and results show mean +/− SEM.
