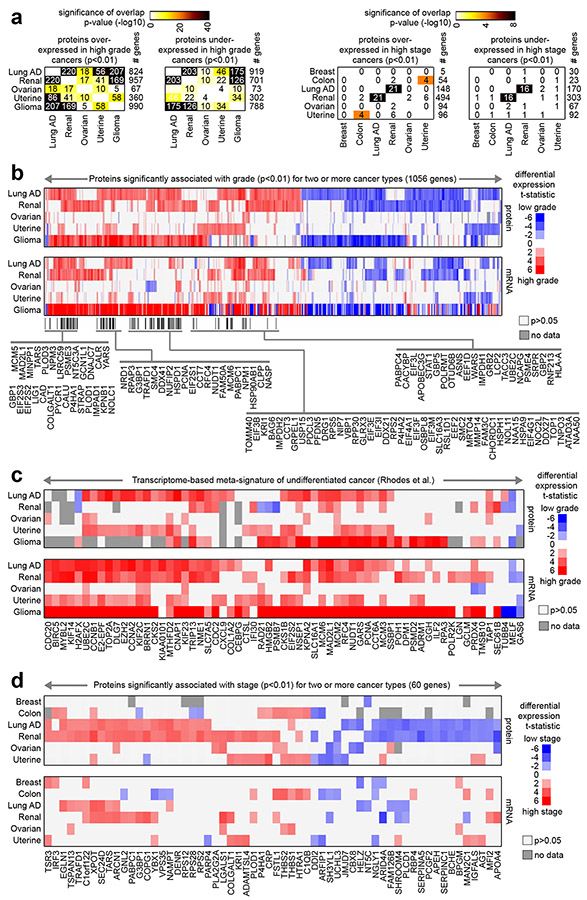
Fig. 3. Proteins shared among the cancer type-specific grade or stage proteomic signatures.
(a) For both the proteins over-expressed or under-expressed with higher grade for at least one cancer type (left, proteins from Fig. 1a) and the proteins over-expressed or under-expressed with higher stage for at least one cancer type (right, proteins from Fig. 1a), the numbers of overlapping proteins between any two cancer types are indicated, along with the corresponding significances of overlap (using color map, p-values by one-sided Fisher’s exact test). (b) Heat map of differential t-statistics (Pearson’s on log-transformed data), by cancer type, comparing higher grade versus lower grade (red, higher expression with higher grade; white, not significant with p>0.05), for 1056 proteins significant for two or more cancer types (p<0.01). Differential t-statistics by grade for the mRNA corresponding to the 1056 proteins are also shown. Proteins significantly over-expressed (p<0.01) with higher grade for three or more cancer types are indicated by name. (c) For both protein and mRNA, differential t-statistics by grade are shown for a set of genes previously identified as part of a transcriptome-based meta-signature of undifferentiated cancer34. (d) Similar to part b, but for a set of 60 proteins significant for two or more cancer types (p<0.01) when comparing higher stage versus lower stage cancers. See also Fig. S7.

