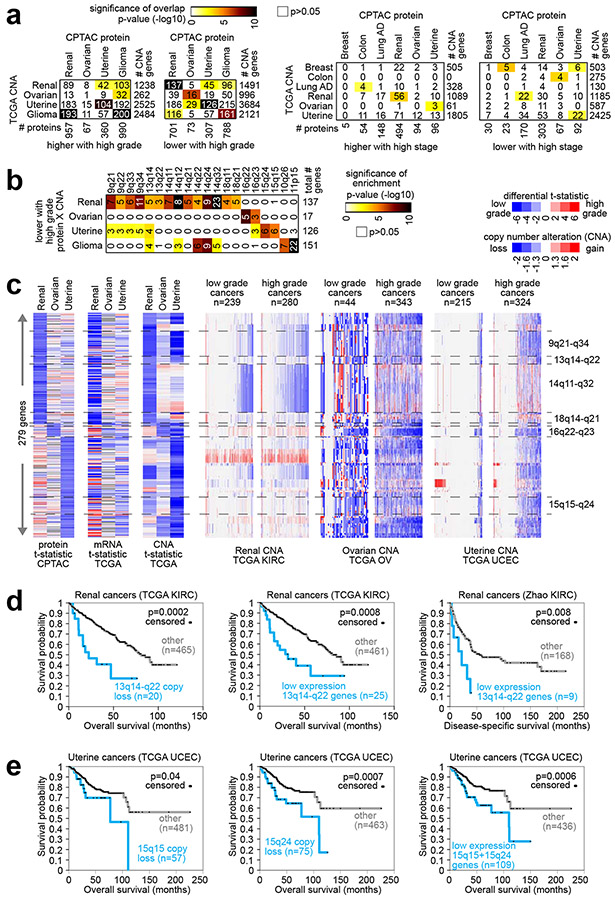
Fig. 4. Copy Number Alterations (CNAs) associated with proteomic signatures of higher versus lower grade cancers.
(a) For both the proteins altered with higher grade for at least one cancer type (left) and the proteins altered with higher stage (right), the numbers of overlapping gene features with protein expression and copy number changes in the same direction (using Pearson’s p<0.01 for each comparison), along with the corresponding significances of overlap (using color map, p-values by one-sided Fisher’s exact test). TCGA LUAD9 CNA data do not include grade information. (b) For the sets of overlapping genes showing both protein under-expression and lower copy numbers with higher grade for renal, ovarian, uterine, or glioma cancer types, significantly enriched cytoband regions (FDR<1%37, one-sided Fisher’s exact test). (c) For the sets of overlapping genes showing both protein under-expression and lower copy numbers with higher grade for renal, ovarian, or uterine cancer types, heat maps represent t-statistics according to increasing grade (blue, lower with higher grade) for differential protein expression, differential mRNA expression, and differential CNA, as well as CNA patterns (blue, copy loss) by cancer type. (d) Taking all of the genes in the 13q14-q22 region (region associated in part b with both copy loss and protein under-expression in high grade renal cancers), overall patient survival in TCGA KIRC38 patient cohort is assessed for cases with copy loss on average for these genes (left) and for cases with low (bottom 5%) average mRNA expression (middle). Overall patient survival is also assessed for low average mRNA expression of 13q14-q22 genes in an independent clear cell renal cell carcinoma dataset46 (right). P-values by log-rank test. (e) In the TCGA UCEC6 patient cohort, overall survival is assessed for cases with copy loss on average for all 15q15 genes (left), for cases with copy loss on average for all 15q24 genes (middle), and for cases with low average mRNA expression of genes (bottom 20%) in 15q15 or 15q24 cytoband regions. P-values by log-rank test. Copy loss for parts d and e defined as average log2 (tumor/normal) less than −0.4. See also Fig. S8.

