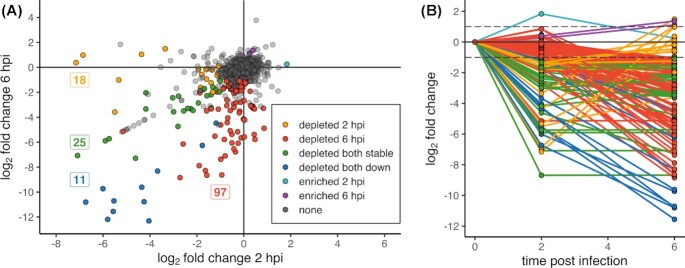
Figure 3.
Few genes are important for the onset but not the late stages of a G. mellonella infection. (A), The plot shows log2 fold-changes at 2 hpi and 6 hpi on the x- and y-axis, respectively. Transposon mutants significantly less abundant at 2 and 6 hpi are shown in yellow and red, respectively. Mutants which are depleted at both timepoints are shown in either green or blue (if the log2 fold-change at 2 hpi roughly equals that at 6 hpi in green and if their abundance was much lower at 6 hpi in blue). Genes significantly higher abundant at 2 hpi and 6 hpi are shown in turquois and purple, respectively. Non-significant genes are shown in grey. Numbers indicate the number of genes of each group. (B), Graph highlighting the direction of the log2 fold-change change over time. Genes are coloured according to A; non-significant genes are not shown.

