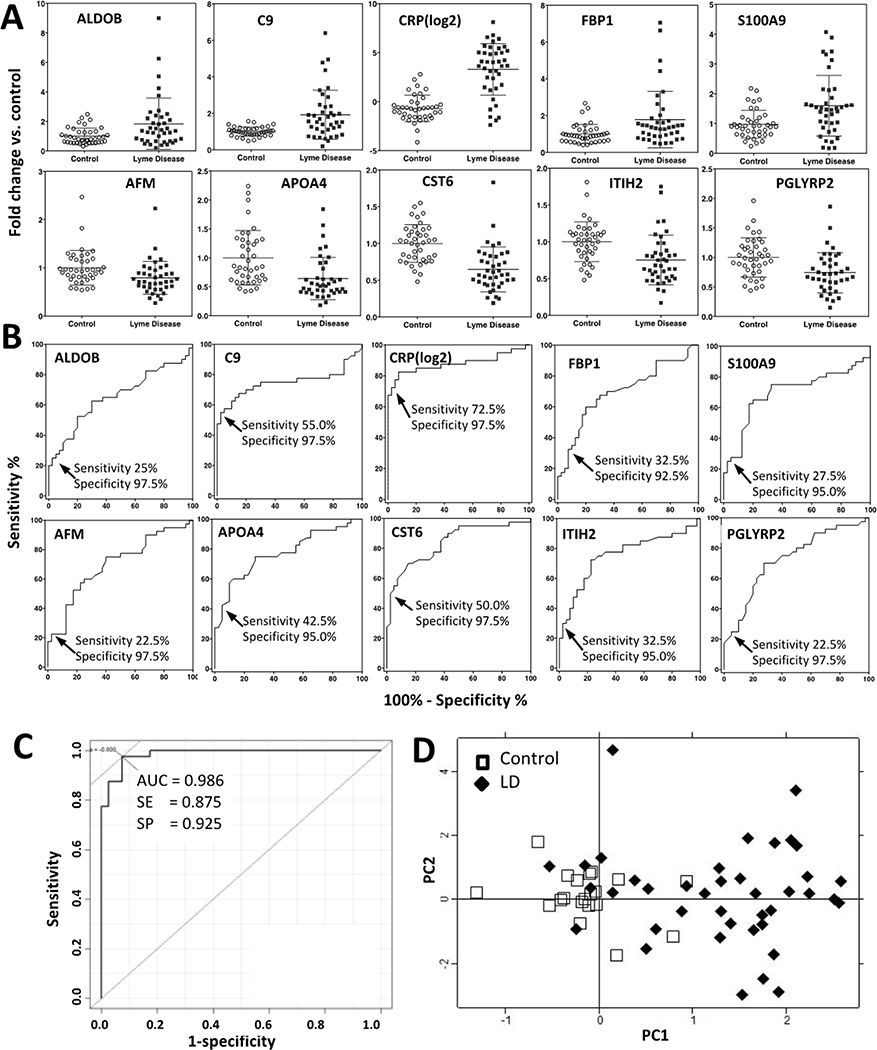
Figure 1.
The 10 early Lyme disease-associated proteins identified by t-test in the discovery cohort (t-Test Set).
1A, Dot plots showing the distribution and mean of relative serum levels with standard deviation for 10 proteins with altered serum levels associated with LD by t-test (Benjamini–Hochberg P < 0.05), at the baseline time point (i.e., at LD diagnosis). The average of control = 1. 1B, Individual AUCs. Cutoff points are shown where low false positive rates (2.5% - 7.5%) are achieved with variable sensitivities. 1C, Combined AUC (whole set) of the 10 proteins to distinguish LD patients from healthy controls. 1D, Biplots of PC1 and PC2 scores of 40 LD patients and 20 healthy controls from unsupervised PCA analyses, computed using the 10 t-Test Set proteins (13 proteotypic peptides). Filled diamonds and open squares represent PC scores for LD patients and controls, respectively.

