Fig. 1.
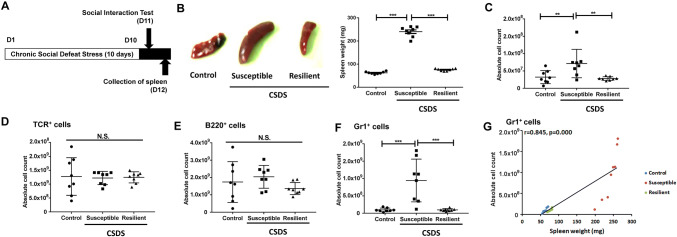
Schedule of CSDS and FACS analysis. a The schedule of chronic social defeat stress (CSDS) model, social interaction test, and collection of spleen. CSDS was performed for 10 days (day 1- day 10). On day 11, the social interaction test was performed to separate CSDS-susceptible mice and CSDS-resilient mice. Control (no CSDS) mice were used as control group. On day 12, spleen from the three groups was collected. b Representative picture of spleen from control (no CSDS) mice, CSDS-susceptible mice, and CSDS-resilient mice. Spleen weight of CSDS-susceptible mice was significantly higher than that of control mice and CSDS-resilient mice (one-way ANOVA, F2,21 = 437.136, P < 0.001). c Total cell number of spleen (one-way ANOVA, F2,21 = 6.616, P = 0.006). d T cells: The number of TCR+ cells in the spleen (one-way ANOVA, F2,21 = 0.032, P = 0.968). e B cells: The number of B220+ in the spleen (one-way ANOVA, F2,21 = 1.429, P = 0.262). f Granulocyte: The number of Gr1+ cells in the spleen (one-way ANOVA, F2,21 = 14.958, P < 0.001). g A positive correlation (r = 0.845, P < 0.001) between Gr1+ cells (for granulocytes) and spleen weight among three groups. Data are shown as mean ± SEM. (n = 8). **P < 0.01, ***P < 0.001 ANOVA analysis of variance, B220 B cells, Gr1 granulocyte receptor 1, CD11b a marker of macrophages, N.S. not significant, TCR T cell receptor

