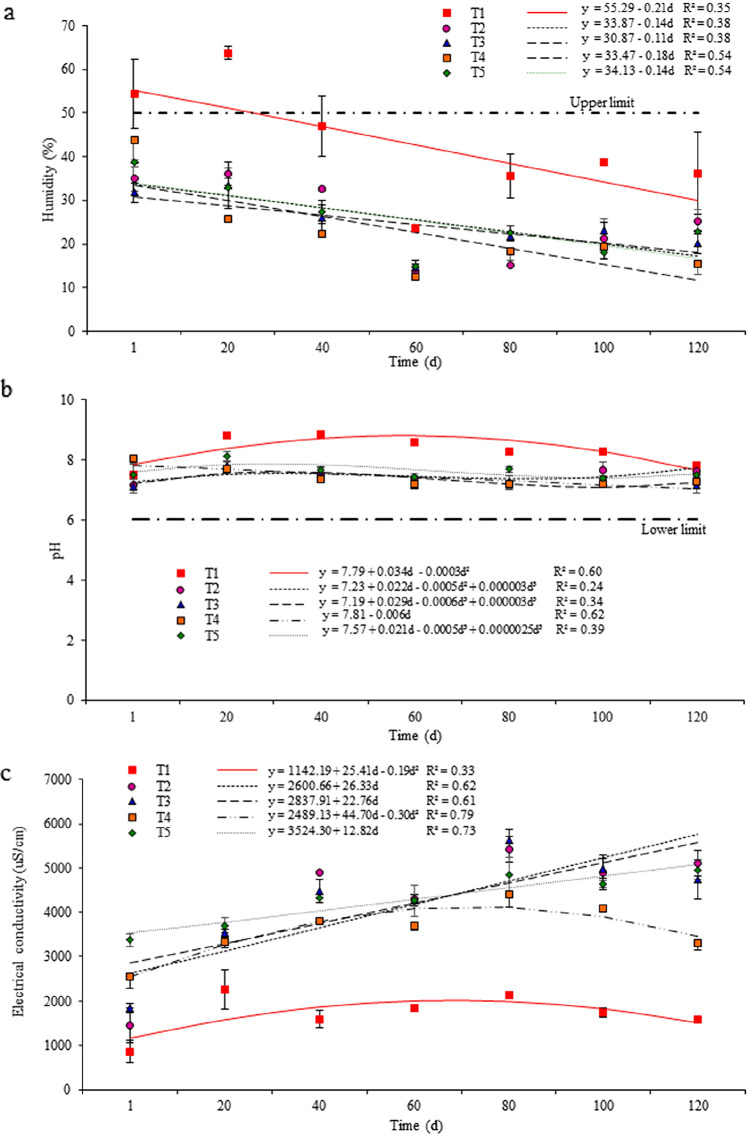
Fig. 2.
Linear regression models to estimate variation in humidity (a), pH (b) and electrical conductivity (c) during 120 days of composting for treatments using distinct raw materials*. *T1 (control): sawdust and float sludge (50:50, v:v); T2: sawdust, float sludge and meal from dead pigs (50:20:30); T3: sawdust, float sludge and meal from dead pigs (50:10:40); T4: sawdust, stabilizing compost and meal from dead pigs (50:20:30); T5: sawdust, stabilizing compost and meal from dead pigs (50:30:20). The adopted limits (horizontal lines) are shown in Table 3

