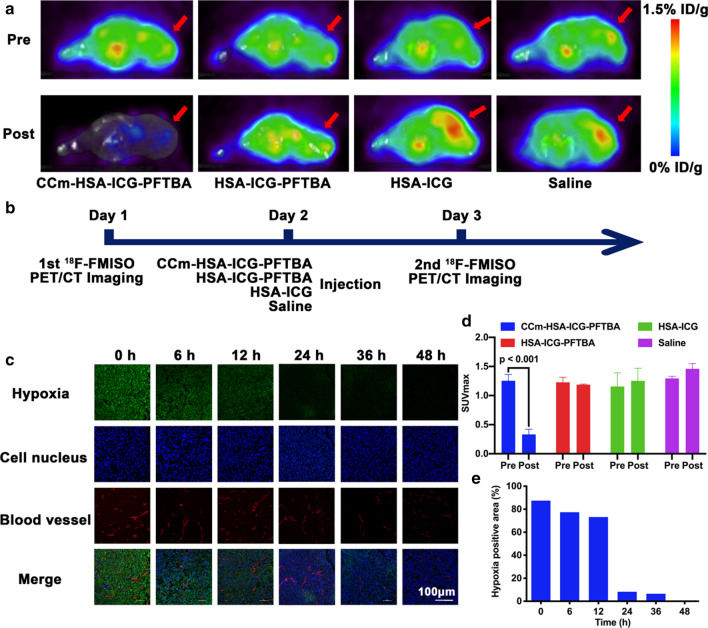
Fig. 5.
Hypoxia improvement at tumor sites. a In vivo transverse 18F-FMISO PET/CT images of TNBC xenografts before and after 24 h injection of the CCm–HSA–ICG–PFTBA, HSA–ICG–PFTBA, HSA–ICG, and saline. Red arrows indicated tumor sites. b Scheme of the PET/CT imaging. c Immunofluorescence images of tumor slices stained by the hypoxyprobe. The blood vessels and hypoxia areas were stained with anti-CD31 antibody (red) and antipimonidazole antibody (green), respectively. Scale bar = 150 μm. d The quantitative analysis of SUVmax at tumor sites of CCm–HSA–ICG–PFTBA, HSA–ICG–PFTBA, HSA–ICG, and saline groups in the pre and post 18F-FMISO PET/CT imaging. e Quantification of tumor hypoxia densities for different time points

