Fig. 7.
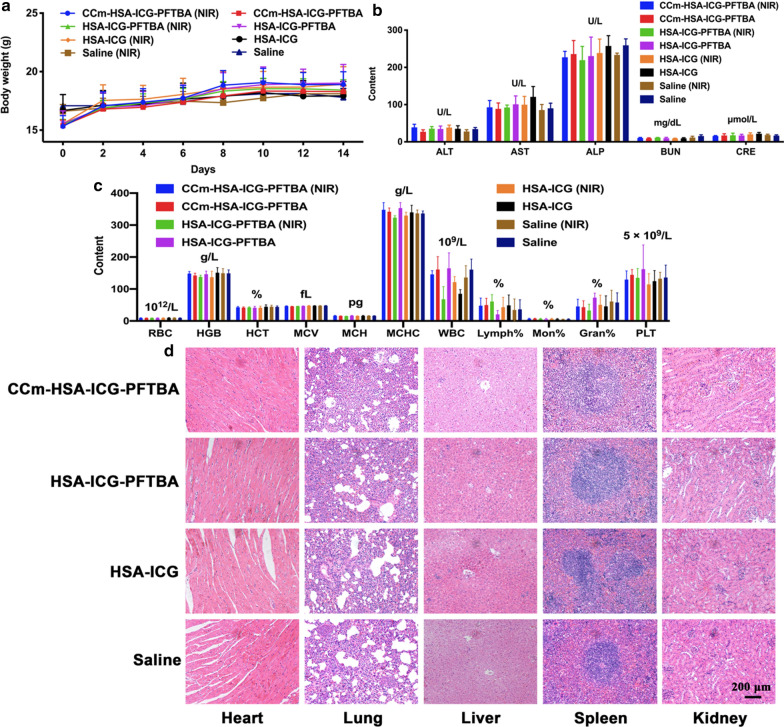
In vivo toxicity evaluation. a Mice body-weight-change curves over 14 days after injection with CCm–HSA–ICG–PFTBA, HSA–ICG–PFTBA, HSA–ICG, and saline, with or without NIR irradiation. b Blood parameters data. Red blood cells (RBC), hemoglobin (HGB), hematocrit (HCT), mean corpuscular volume (MCV), mean corpuscular hemoglobin (MCH), and mean corpuscular hemoglobin concentration (MCHC). c Blood biochemistry data. Alanine transaminase (ALT), aspartate aminotransferase (AST), alkaline phosphatase (ALP), blood urea nitrogen (BUN), and creatinine (CRE). d White blood cells (WBC), lymphocytes percentage (Lymph%), monocyte percentage (Mon%), and neutrophil percentage (Neu%). e Platelets (PLT). f H&E-stained slice images of major organs. Scale bars = 200 μm. Data are represented as mean ± SD (n = 6)

