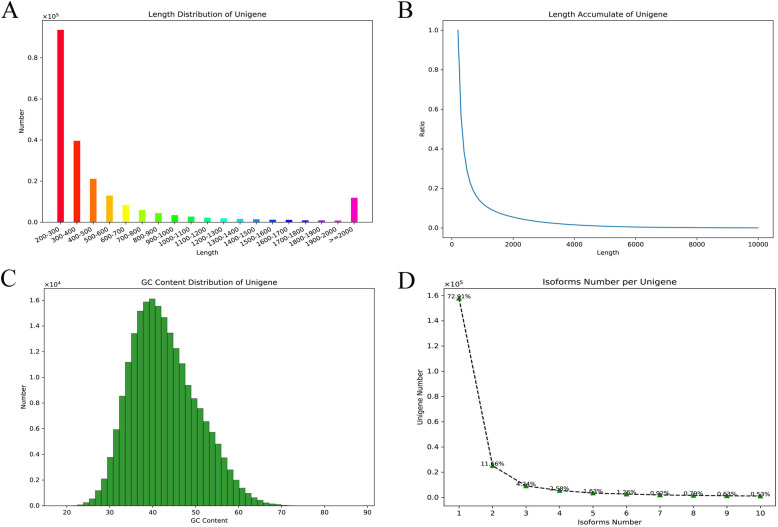
Fig. 2.
The assembly and information of the transcriptome data of the P. clarkii ovary. a: The length distribution of unigenes after assembly, the abscissa represents the length range of unigenes, the ordinate represents the number of unigenes corresponding to the length. b: The length accumulate of unigenes after assembly, the abscissa represents the length of unigene, the ordinate represents the ratio of unigenes which were more than the corresponding length. c: The GC content distribution and the corresponding numbers of unigenes. d: The distribution of isoforms number per unigene

