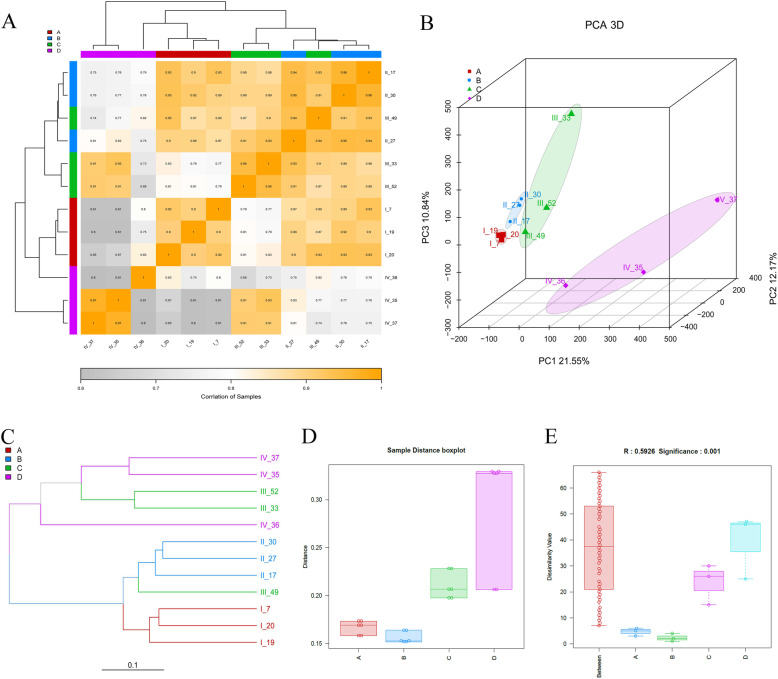
Fig. 4.
The correlation of ovary samples at different stages of P. clarkii based on the RNA-seq analysis. a: The heatmap of the Pearson coefficients among all the ovary samples. The more grey the color of the block, the lower correlation between two samples; the more yellow the color, the higher correlation between two samples. b: The Principal Component Analysis (PCA) of all the twelve ovary samples. c: Hierarchical clustering based on the distances among the twelve samples. The length of the branch represents the distance between the two samples, the more similar the samples, the closer they get. d: The sample distance boxplot of the four stages. e: The analysis of similarity (Anosim) boxplot among different groups. Note: The alphabet of a, b, c and d in the graph represent the stage I, stage II, stage III and stage IV, respectively

