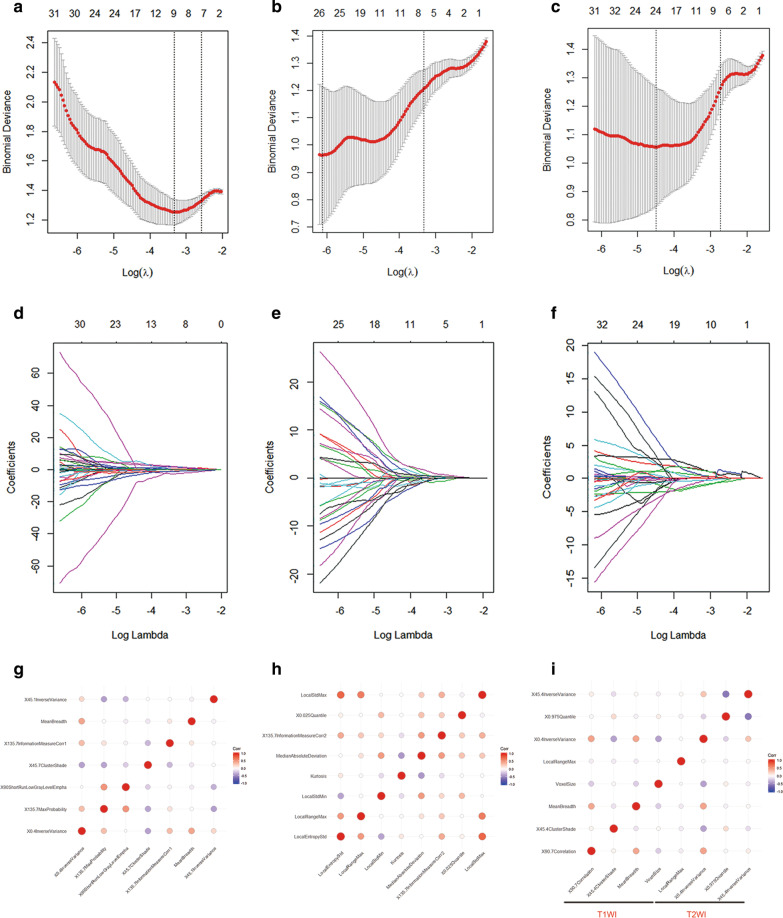
Fig. 3.
a–f LASSO regression was used for feature selection. The deviance curve was plotted, and the parameter (λ) selection was tuned using tenfold cross-validation. Dotted lines denote the minimum criterion (right) and 1-SE of the minimum criteria (left). The 1-SE criterion was applied, and there were respectively 7 features in the T1WI sequence (a, b) with non-zero coefficients (the optimal value of λ = 0.07543); 8 features of the T2WI sequence (c, d) with non-zero coefficients (the optimal value of λ = 0.03457); 8 of the T1-2WI sequence (e, f) with non-zero coefficients (the optimal value of λ = 0.06485). g–i Spearman’s correlation coefficients were calculated for the features in the T1WI, T2WI and T1-2WI sequences. No pair of features showed extremely strong positive correlations among the feature groups (0.90–1.00)

