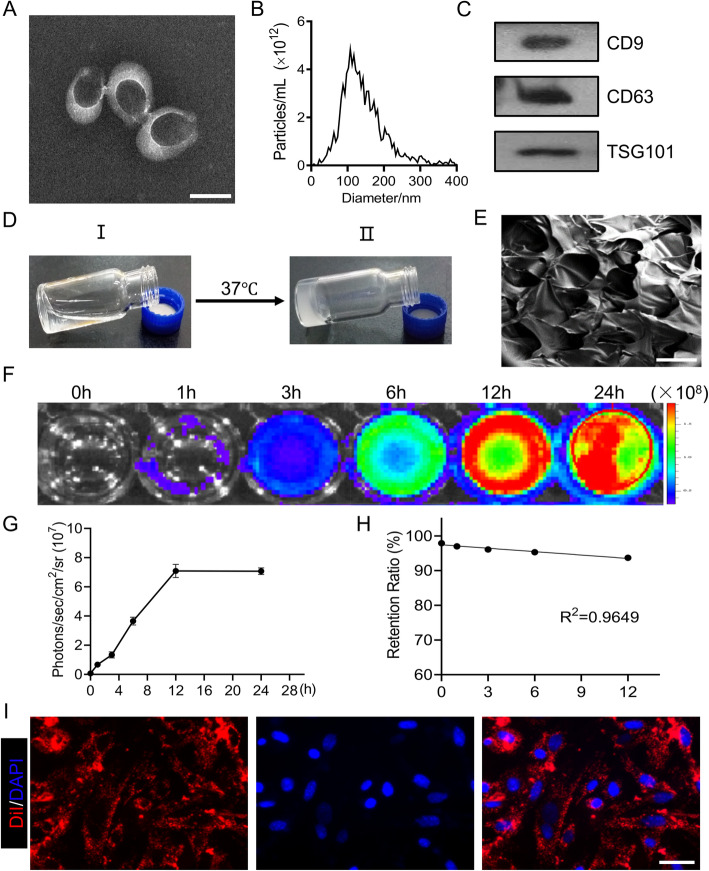
Fig. 1.
Characterization of MSC-EVs and thermosensitive chitosan hydrogel. a TEM photomicrograph of EVs. Scale bar, 100 nm. b Size distribution of MSC-EVs was measured by NTA in scatter mode. c The protein markers of MSC-EVs were detected by Western blotting. d Optical images of the chitosan solution (I) and hydrogel (II). e SEM photograph of chitosan hydrogel. Scale bar, 100 μm. f, g The released EVs were measured by quantitative analysis of Gluc signal. h Retention ratio of EVs in CS-EVs after immersing in PBS within 12 h (R2 = 0.9649). The signal activity was represented by photons/s/cm2/steradian. i Dermal fibroblast cells could uptake CM-DiI-labeled EVs (red). Scale bar, 100 μm

