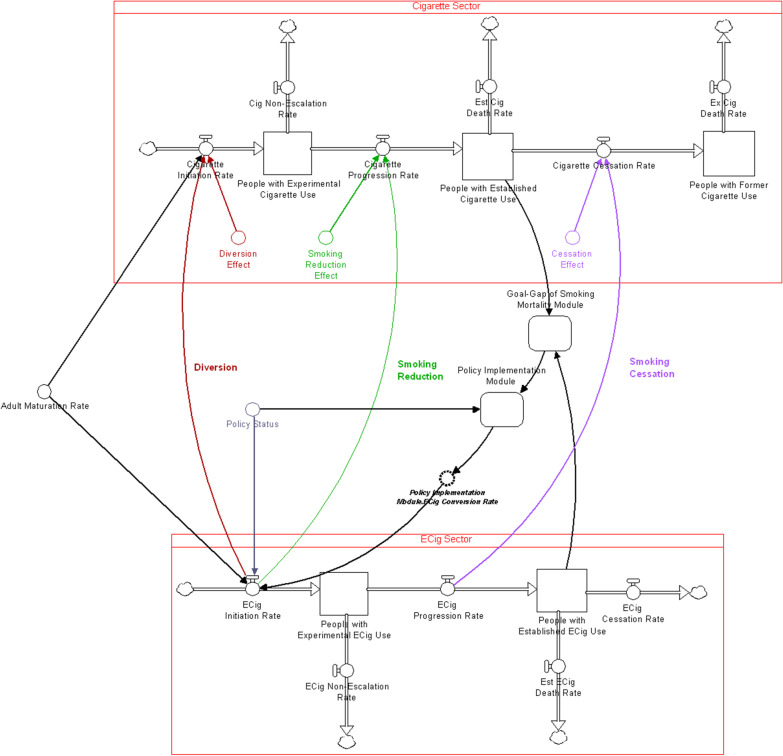
Fig. 2.
Simplified structure of the stock-and-flow model. Separate aging chains represent cigarette use (top sector) and e-cigarette use (bottom sector) with stocks (represented as squares) for different stages of use, and corresponding flows (represented as valves). The stock of individuals with “established cigarette use” and “established e-cigarette use” drives mortality, and this motivates policy implementation which targets e-cigarette initiation rate. This policy acts in 3 ways: diversion from cigarette initiation, reduction in the smoking progression rate, and increasing the cigarette cessation rate

