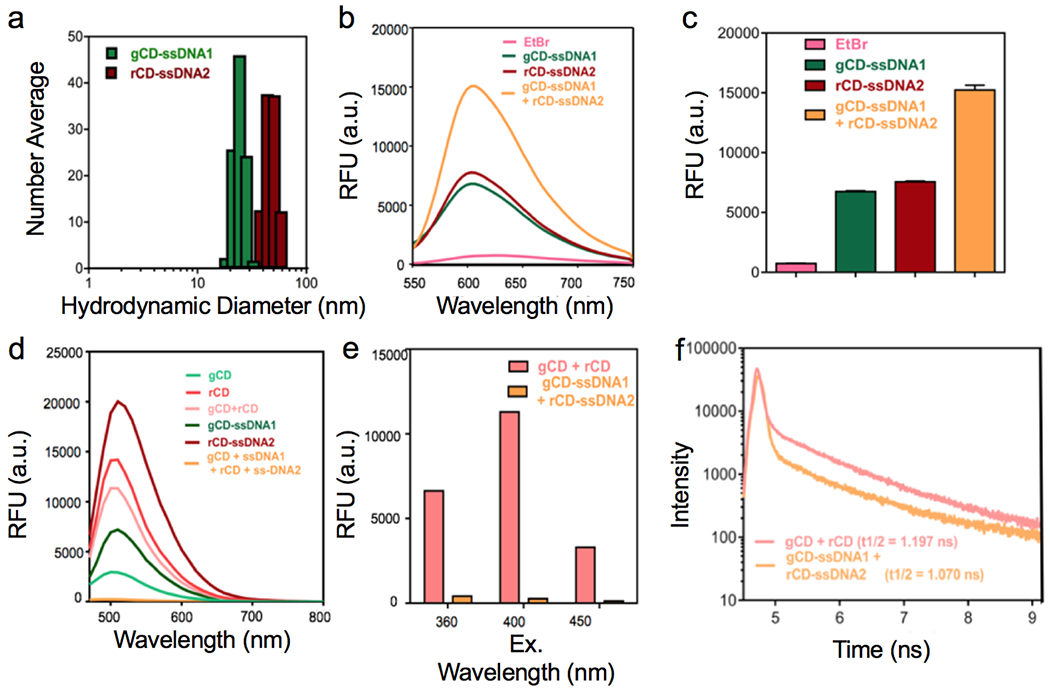
Figure 2.

(a, b) Ethidium bromide intercalation study to confirm the formation of ds-DNA and PL intensity comparison between different samples. (c) Emission spectra profiles of different samples at λex. = 400 nm, (d, e) Corresponding emission spectra profiles comparison for gCD + rCD and gCD-ssDNA1 + rCD-ssDNA2 at different excitation wavelengths, (f) Time-resolved PL study performed on gCD + rCD and gCD-ssDNA1 and rCD-ssDNA2 mixtures, at excitation wavelength of 510 nm.
