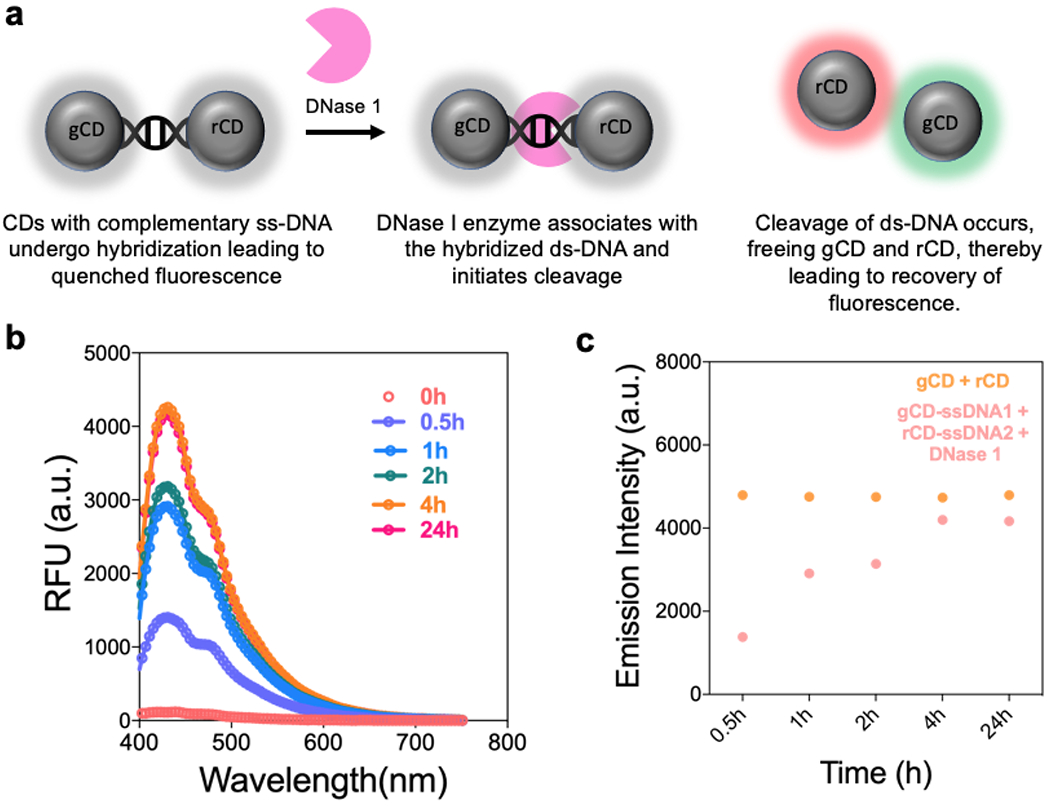
Figure 3.

(a) Schematic representation of the recovery of luminescence of gCD-ssDNA1 and rCD-ssDNA2 in presence of endonuclease enzyme, DNase 1. (b) Fluorescence emission intensity profile of gCD-ssDNA1 + rCD-ssDNA2 without (t = 0) and with 1U/mL DNase I as a function of incubation time varying from 0.5h to 24h. (c) Emission intensity comparison at 430 nm for gCD + rCD and gCD-ssDNA1 + rCD-ssDNA2 (in presence of DNase I) as a function of time.
