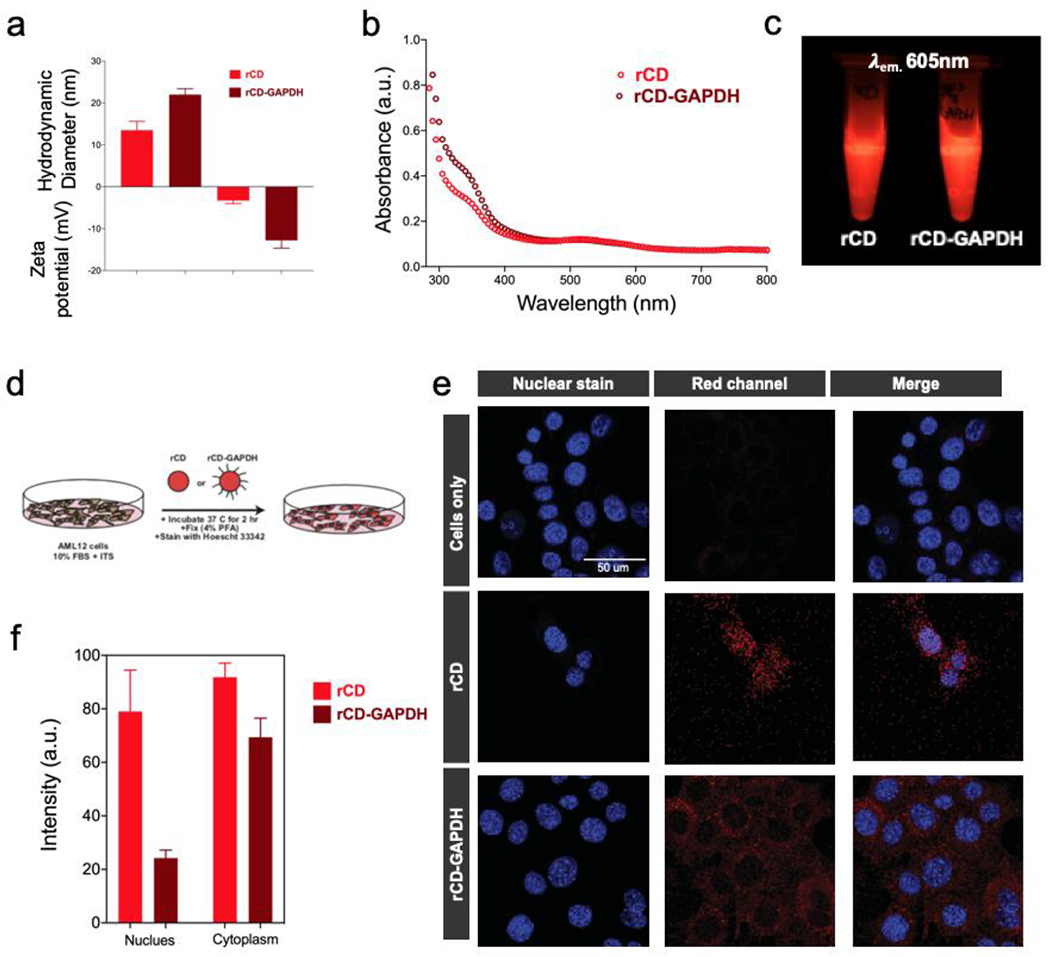
Figure 6.

(a) Hydrodynamic diameter measurements, zeta potential measurements and (b) UV-Vis absorbance spectroscopy measurements for rCD and rCD-GAPDH. (c) Photographic presentation of rCD and rCD-GAPDH samples under exposure of light at 605 nm. (d) Representation of culture conditions used in cell experiment for confocal studies. Confocal intracellular imaging of CD treated cells and quantifications. (e) Localization of rCD and rCD-GAPDH in intracellular space and (f) respective differential intensity of CD fluorescence originated from nuclear and cytoplasmic regions.
