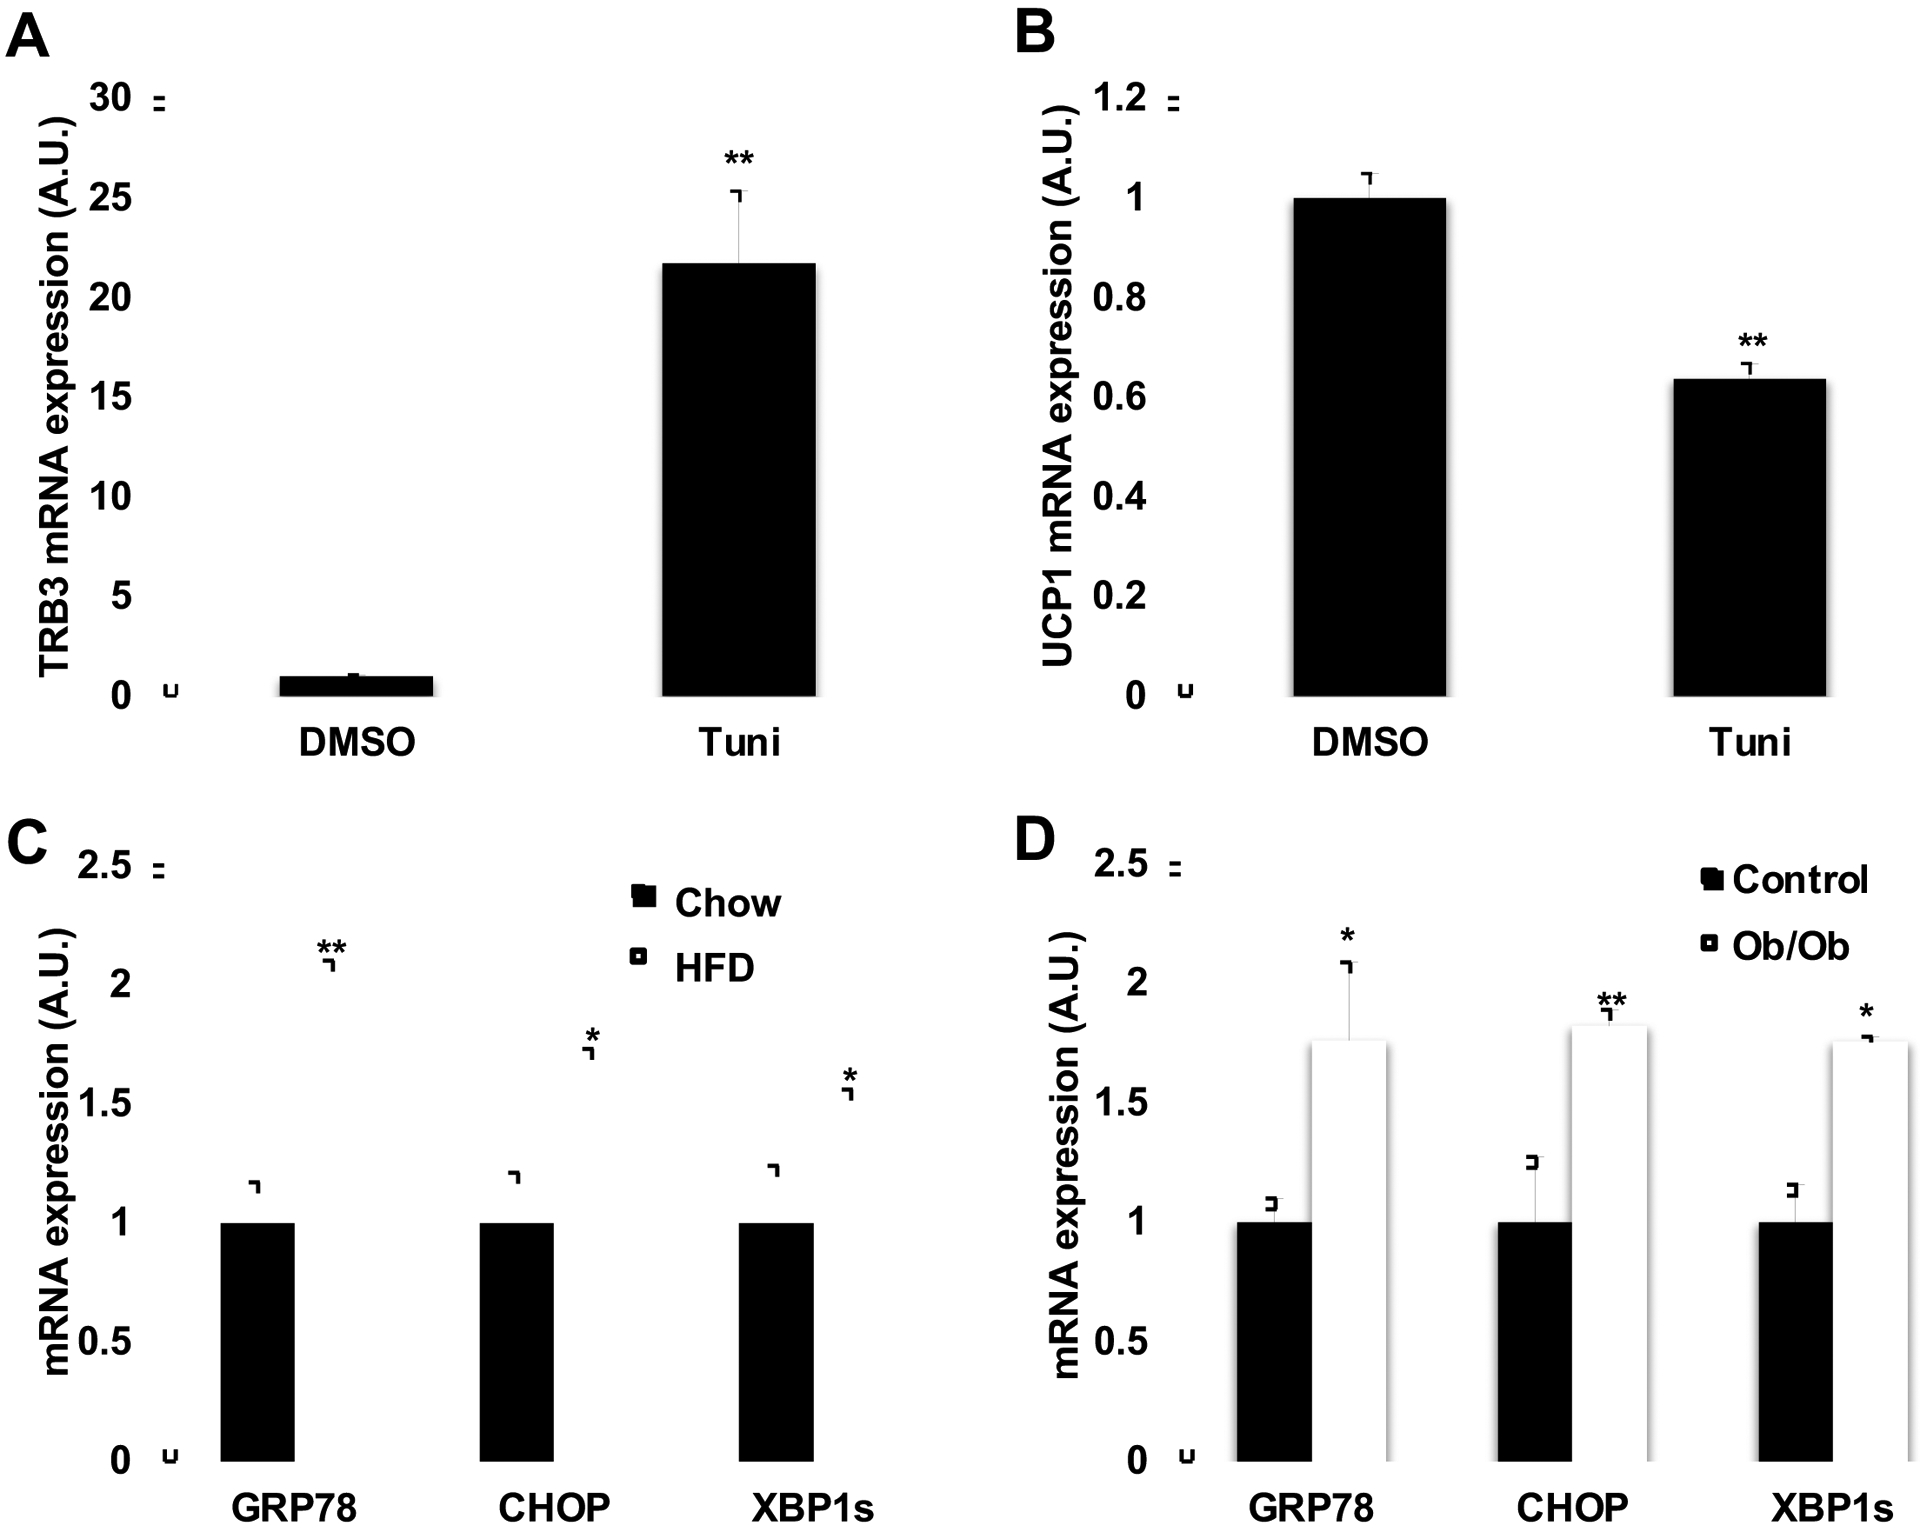
Fig. 3. Effect of ER stress and TRB3 on UCP1 expression.

(a,b) Brown preadipocytes were differentiated to brown adipose cells for 8 days. Cells were incubated with an ER stressor, tunicamycin (1 μg ml−1) for 4h and were collected to determine TRB3 (a) and UCP1 (b) mRNA expression using Real-time PCR analysis (n=5). (c,d) Real-time PCR analysis was performed to determine mRNA expression of genes involved in ER stress in BAT from high fat fed mice (c) or ob/ob mice (d) (n=4–6). Data are the means ± S.E.M. * indicates p<0.05, and ** indicates p<0.01 vs. basal or controls.
