FIGURE 2.

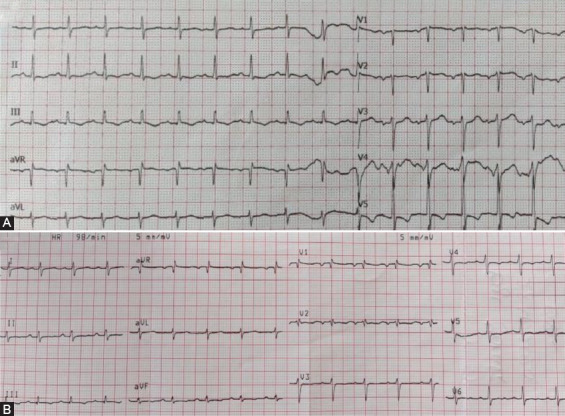
Electrocardiogram of our patients. (A) 1° patient: Negative T wave in all precordial leads; QTc interval was 0.48 s; (A) 2° patient: Negative T wave in all precordial leads QTc interval was 0.47 seconds.

Electrocardiogram of our patients. (A) 1° patient: Negative T wave in all precordial leads; QTc interval was 0.48 s; (A) 2° patient: Negative T wave in all precordial leads QTc interval was 0.47 seconds.