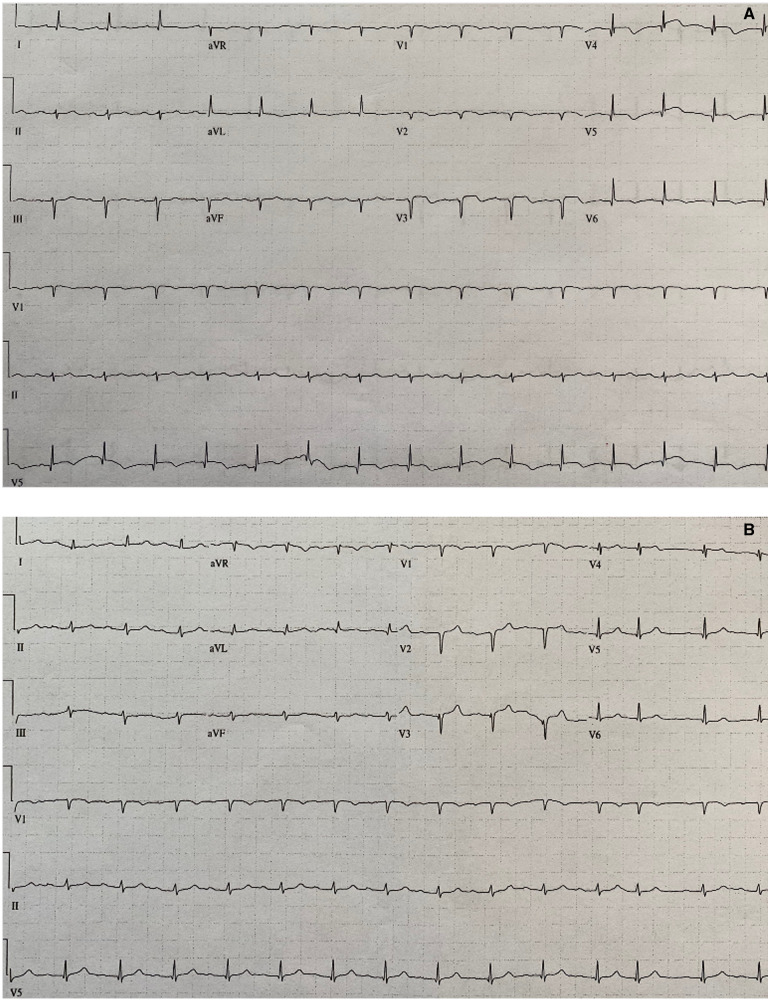
Figure 3.
(A) Electrocardiogram on hospital Day 2, about 24 h after admission electrocardiogram. Compared to admission electrocardiogram, leads V2 and V3 show loss of R wave, deepened Q waves, ST-segment flattening, and T wave inversions. (B) Electrocardiogram on hospital Day 7. Overall, QRS voltage has slightly decreased. In leads V2 and V3, T wave inversions are no longer present, but the Q waves have deepened.

