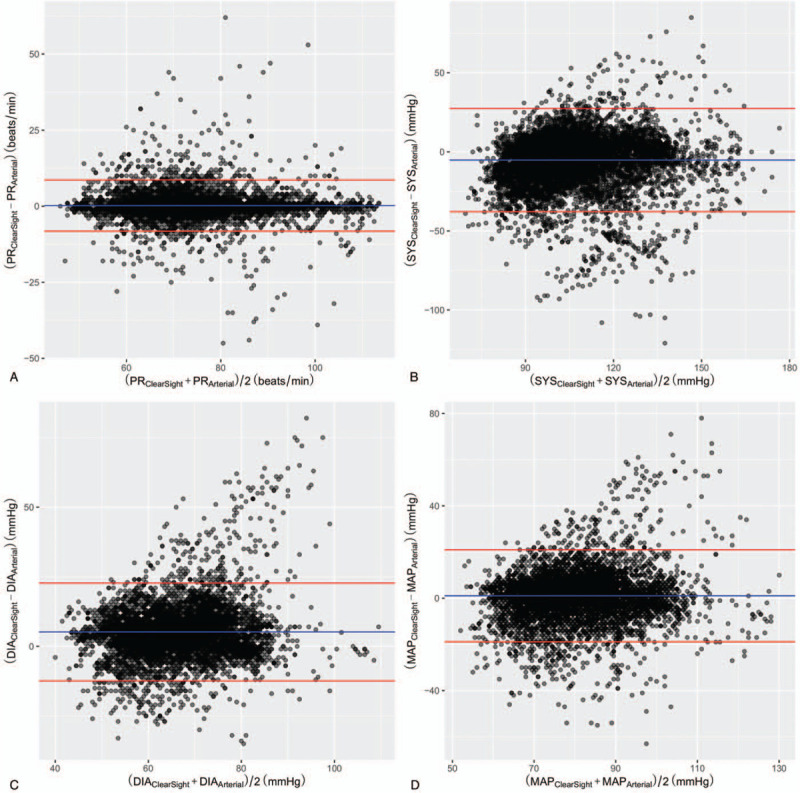
Figure 2.

Bland–Altman plot for arterial blood pressure measurements with bias and 95% limits of agreement. Bland–Altman plot showing accuracy (A) between PRClearSight and PRArterial, (B) between SYSClearSight and SYSArterial, (C) between DIAClearSight and DIAArterial, and (D) between MAPClearSight and MAPArterial. PR = pulse rate, SYS = systolic blood pressure, DIA = diastolic blood pressure, MAP = mean arterial blood pressure.
